Working with graphs
- Copy Space for Confluence
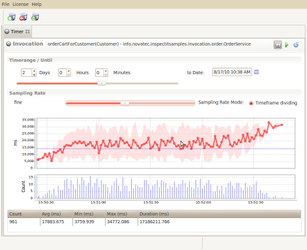
Minimum and maximum values
Each graph shows the average value using a thick line. In addition to that minimum and maximum values are provided as a cloud around the average.
Zooming
The best way to zoom a graph is to use the "Zoom" functionality within the right-click menu and select "Zoom".
Zooming using the mouse
Another way of zooming in the graph is to drag a selection box from left to right (important) around the region that you are interested.
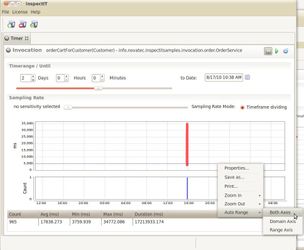
Auto Range
Each graph provides an auto ranging functionality. Auto ranging is available as right-click menu of the graphs. This allows to rearrange the range to display all data of this graph. Auto ranging is applicable to both axis or one only selected axis. Auto ranging is often nice when Viewing historical data as the range is often not set to see all data in a meaningful way.
Below is the output of a search for historical data of a Timer. The first view does not help the analyst and he is forced to zoom in by himself.
|
|
|
|
|
Sometimes "autoranging all" does not cover all data
In case not all data is presented, perform an additional auto-range on the axis that is missing
Exporting / Saving
Each graph provides the functionality to be saved to a file by means of the right-click menu.