Working with the aggregated timer data view
- Copy Space for Confluence
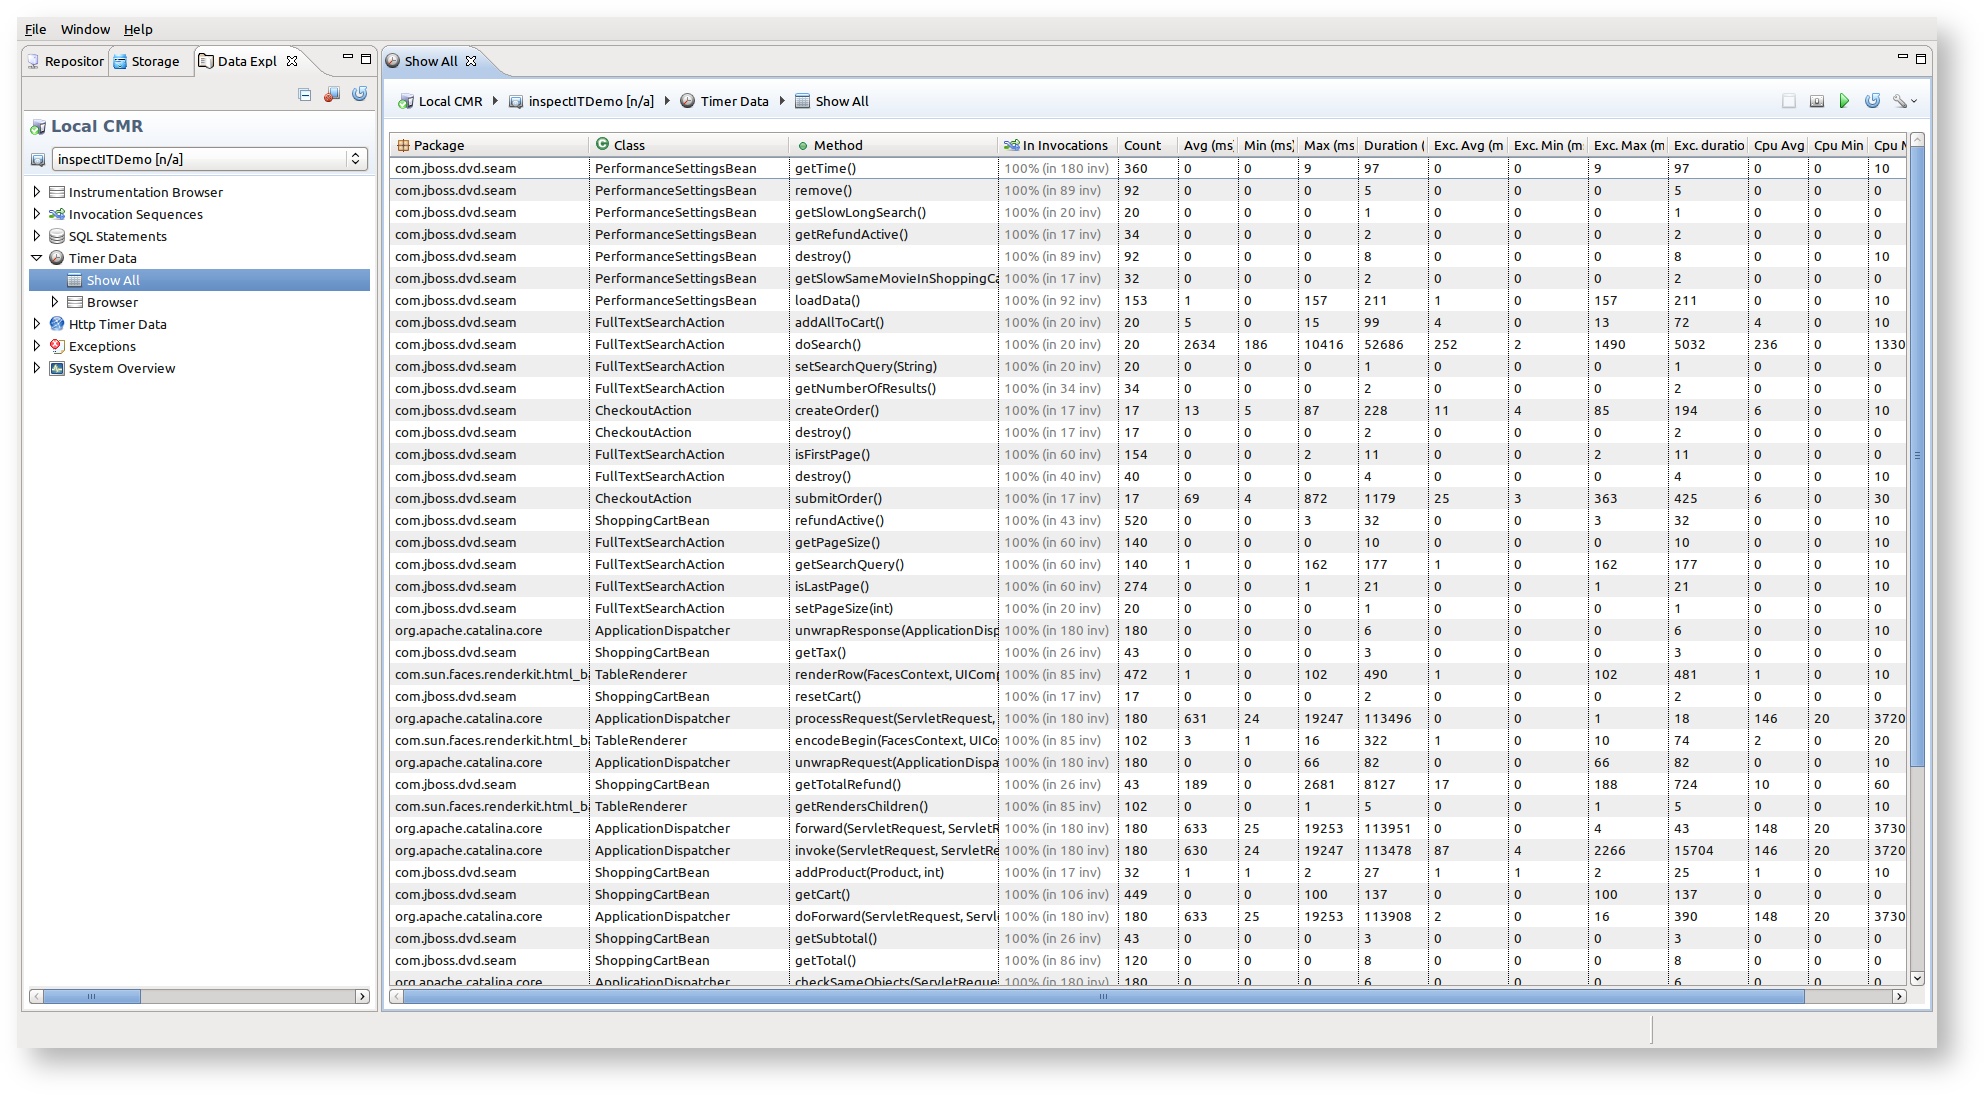
The aggregated timer data view shows - as the name suggests - an aggregated view of all timer data that are currently held in the memory buffer. Timer data elements that are removed from the memory buffer due to the limited amount of memory available will not be shown in this view. Thus treat this view as a live view on the data you are currently having and keep data removal in mind.
Adjustable time resolution
For the better overview, all the times in aggregated view like this one are presented in milliseconds, without decimal places. However, you can also display the decimal places if the higher resolution is needed. Use the view menu in top-right corner and select desired value in the "Decimal places" group.
Interpreting exclusive times
Exclusive times can only be calculated if the timer was invoked within an Invocation Sequence. Timers that are not invoked within an invocation sequence are standalone and do not know how much time the method itself took and how much time the methods took that are called from this one. inspectIT provides a warning sign if not all timers are invoked within an invocation sequence. please be aware that in this case the calculation of the exclusive timings (avg, max, min, duration) is incorrect and only takes those timers into account that actually ran within an invocation sequence. The less timers did, the lower the quality of the exclusive times. The invocation sequence percentage is also provided.
Navigation
It is easily possible to navigate from a selected timer data element to all invocation sequences that invoked this timer data. More information is provided here.
Loading data from a specific time-range
This view enables a user to specify a time-range that the displayed data should be in. By clicking to the  icon the time-range selection opens, where you can select the wanted time-range for displayed data. Note that the entered duration will be relative to the selected until date. Selecting duration of one hour to the current time, will display the data that was collected in the last hour.

Charting of the Timer data
from version 1.5
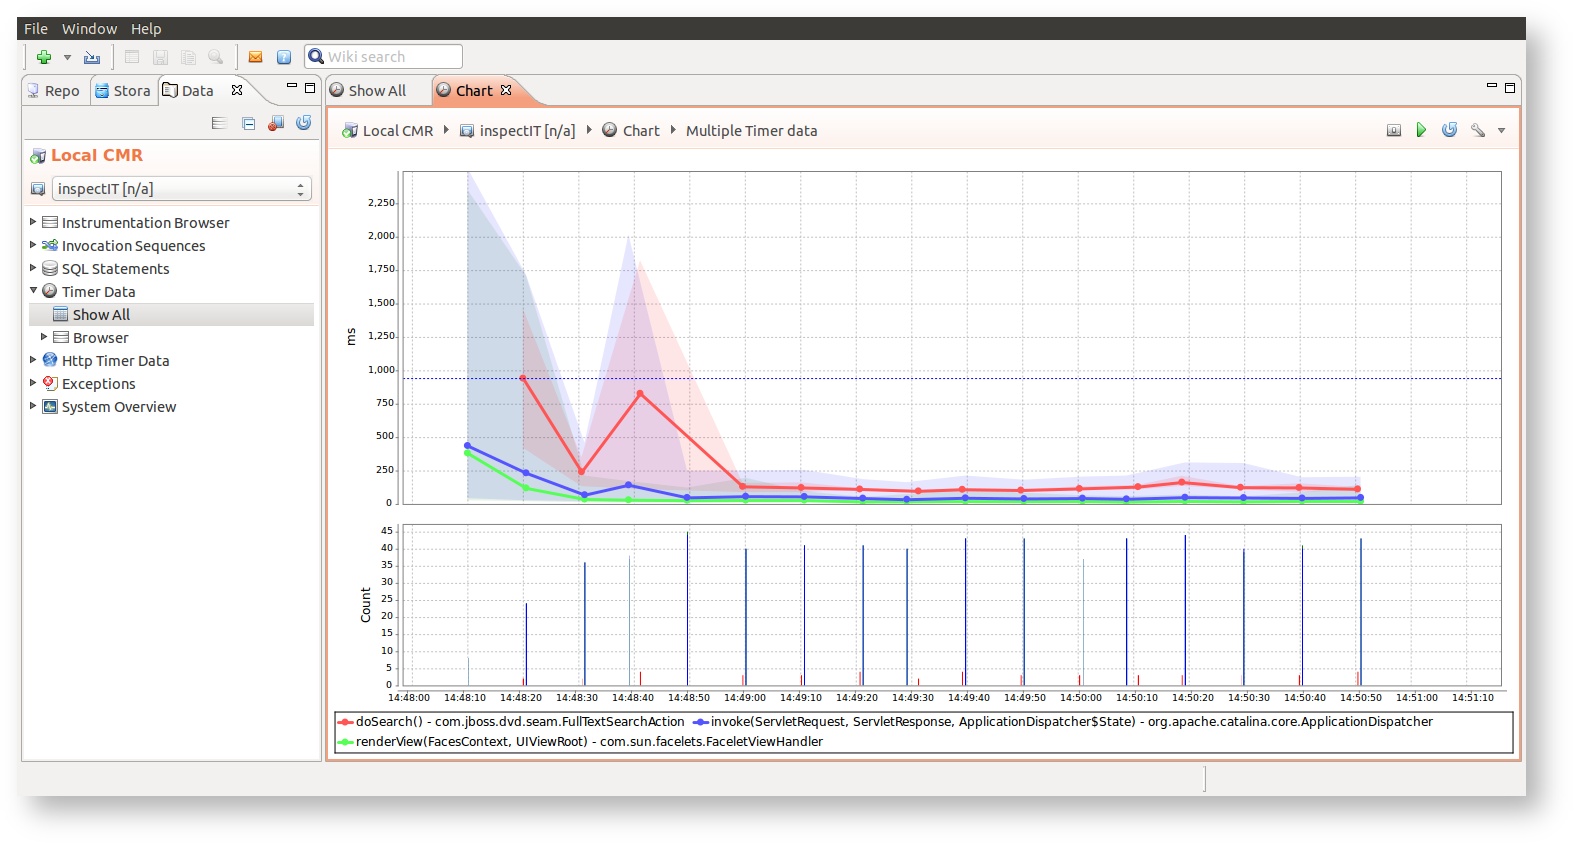
If the Charting Option is activated for the timer sensor assignments, the timer data will be considered as long-term data. This enables the timer data to be displayed in charts.
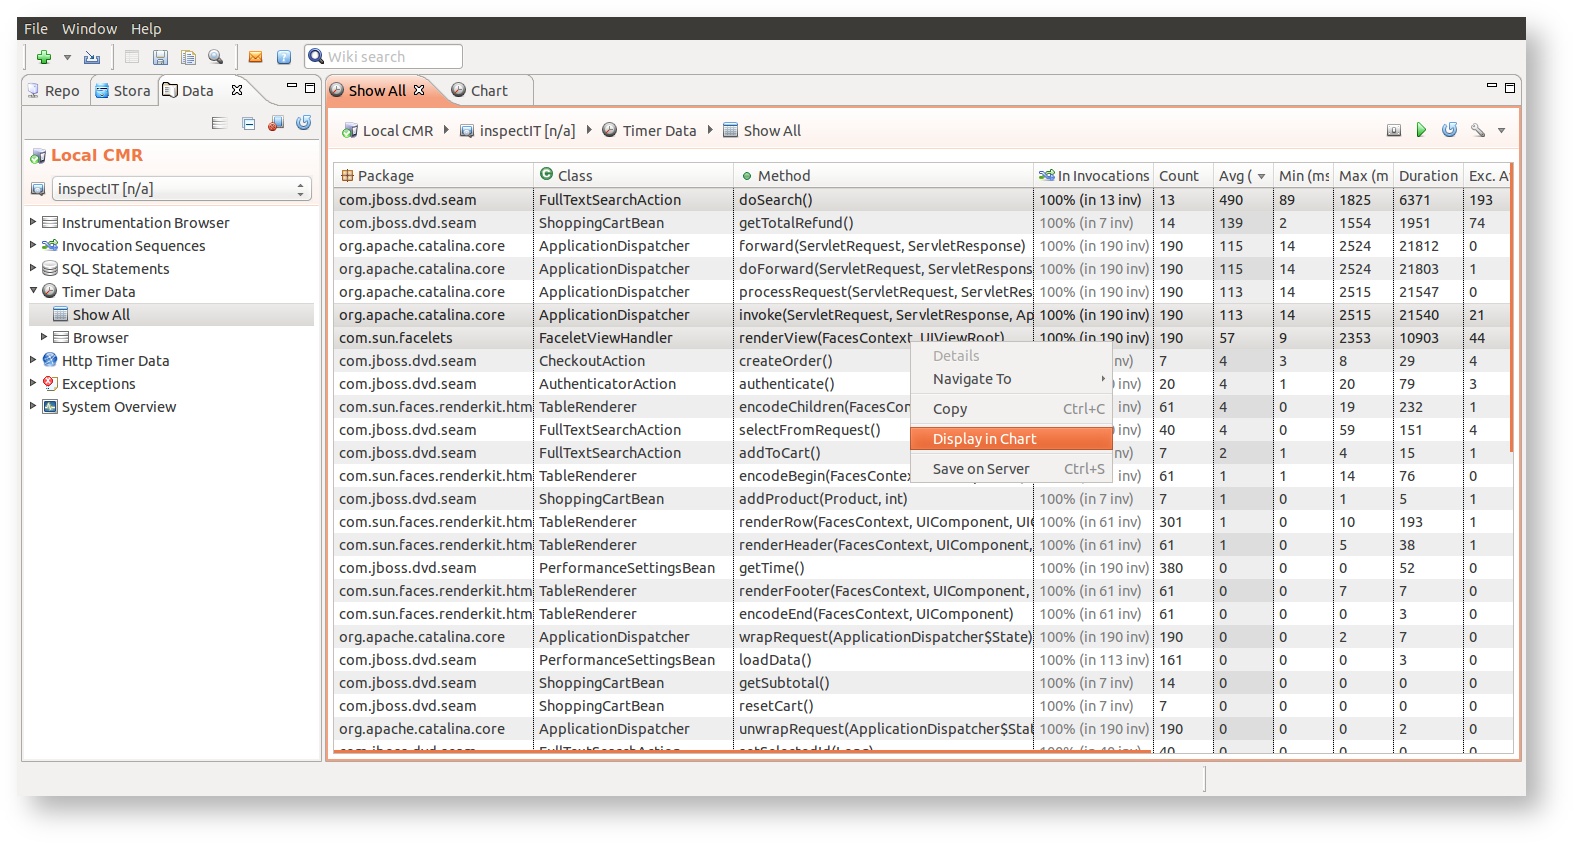
The chart with the timer data can be created directly from the Aggregated Timer Data view. Timers that have the Charting Option activate will be marked with the  icon. A right-click on one or more method entries will open the right-click menu offering the 'Display in Chart' option. Click on this option will open the chart in new window.
The page Viewing historical data provides additional information on how to control the displayed historical data.