Working with navigation and stepping functionality
- Copy Space for Confluence
Overview
From the version 1.2 inspectIT provides improved navigation functionality in the User interface, that enables a user to analyze the performance data by jumping from one element to another, and locating the desired element in the invocation tree representation.
Navigation
Navigate to Invocations
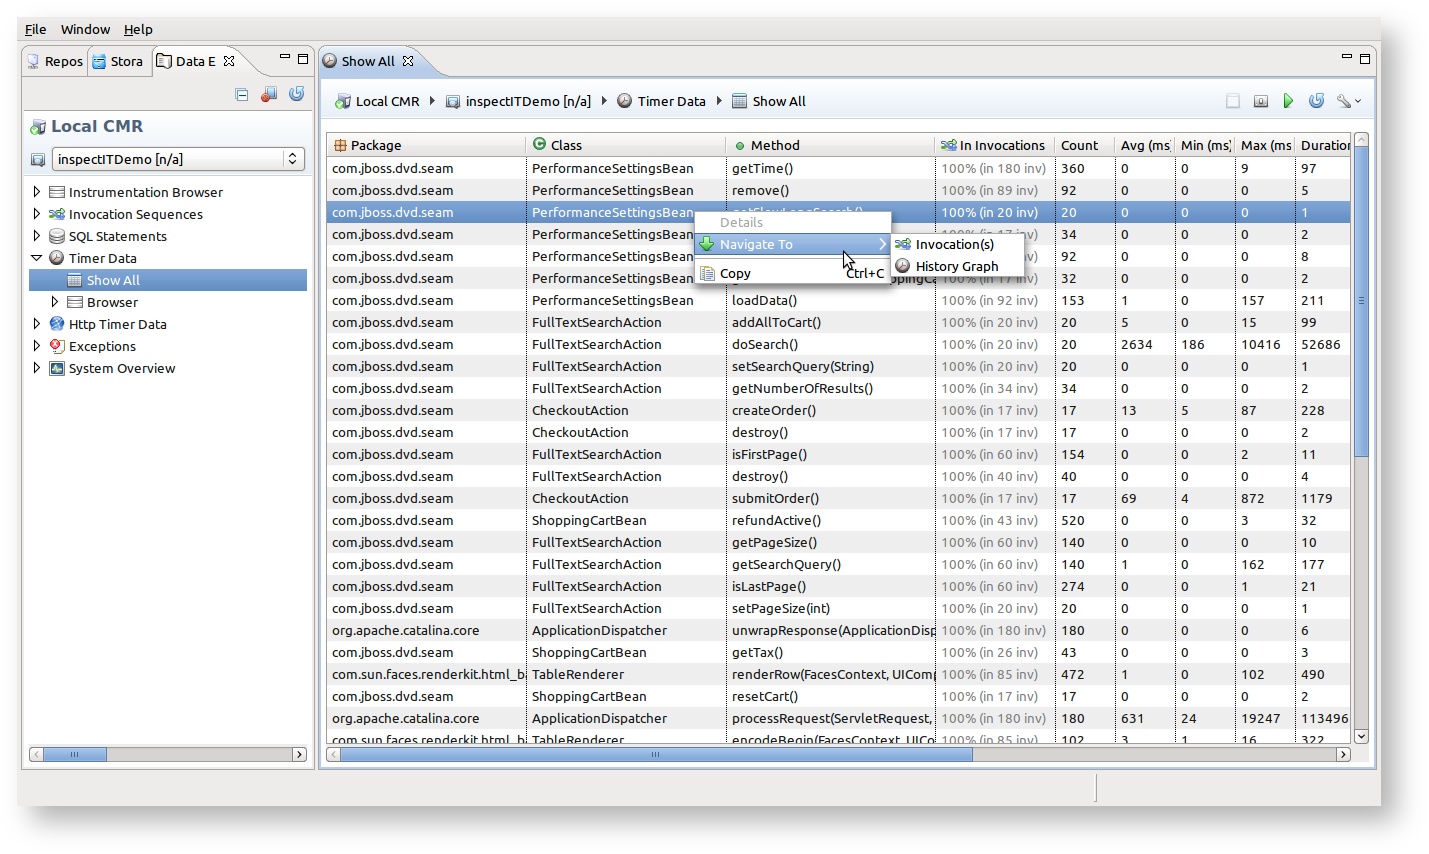
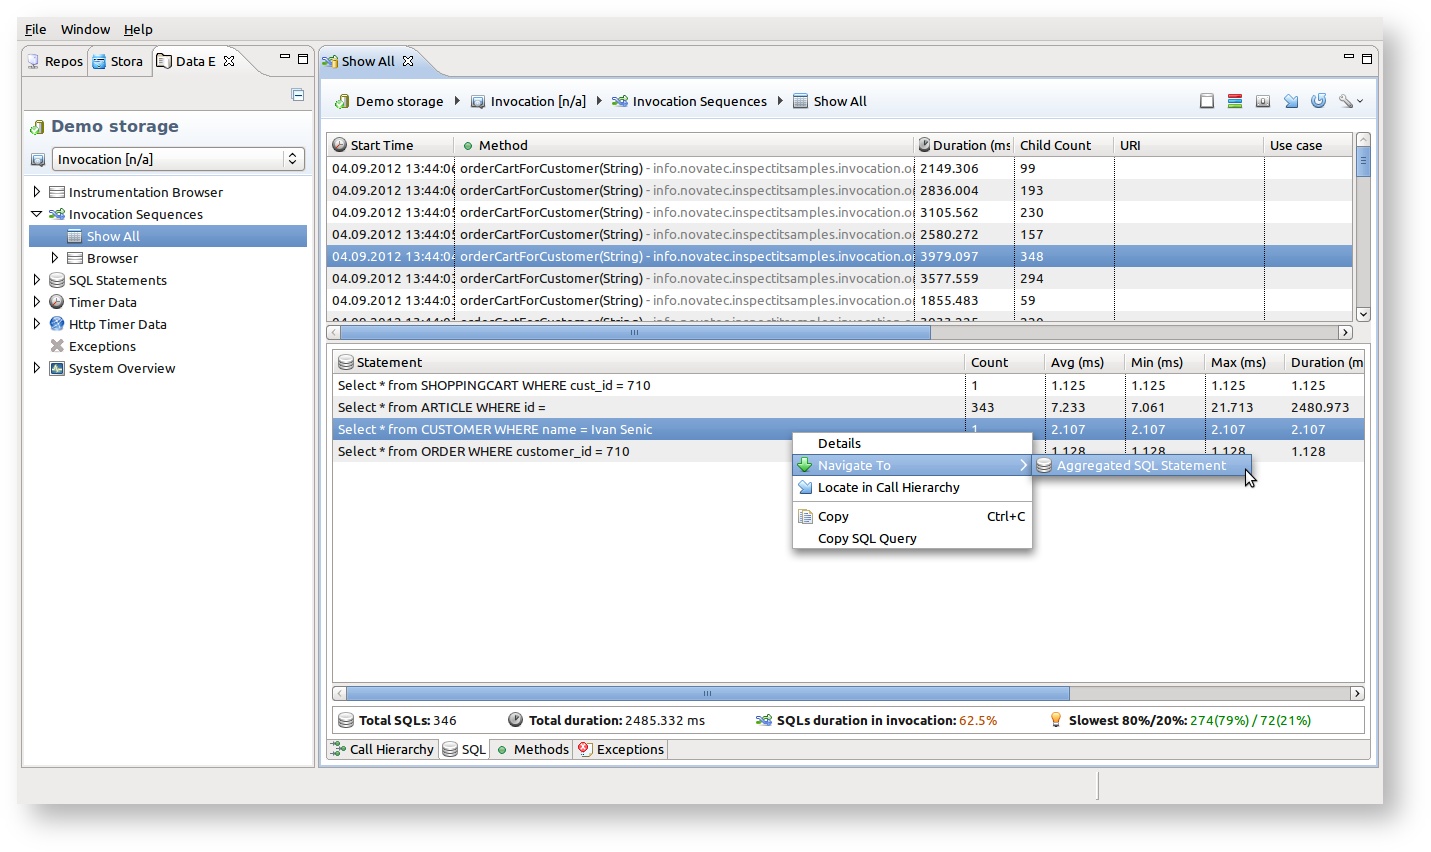
Navigate To Invocations provides a possibility to select the wanted performance element that can be found in the invocation sequence data (SQL Statement, Timer Data or Exception), and to list all the invocations where this element can be found. The simple example can be the Aggregated SQL view, where a user can simply select one SQL statement and choose the option  Navigate To ->
  Invocations (available on right-click menu). Furthermore, it is also possible to select more than one SQL statements, and choose the Navigate To Invocations option. In this situation a user will be able to see all the invocations where all selected elements can be found.
The aggregated SQL statement, Timer and Exception views now also provide an information if the element can be found in the invocation sequences or not. This information is represented in percentages, where 100% means that all the elements are inside the invocation(s), while 0% means that no element is contained in the invocation(s). Furthermore, the views provide an information on number of invocation sequences where elements can be found.
Navigate to History Graph
From any method invocation you can navigate to the history graph that displays the historical execution duration of the selected method with a graphical representation. This navigation is possible from Aggregated Timer view, Invocation tree and Invocation method sub-view. Just click on the Navigate To ->  History Graph in the right-click menu.
History graph can also be opened from the Data Explorer View tree menu items  Instrumentation Browser and Timer Data > Browser
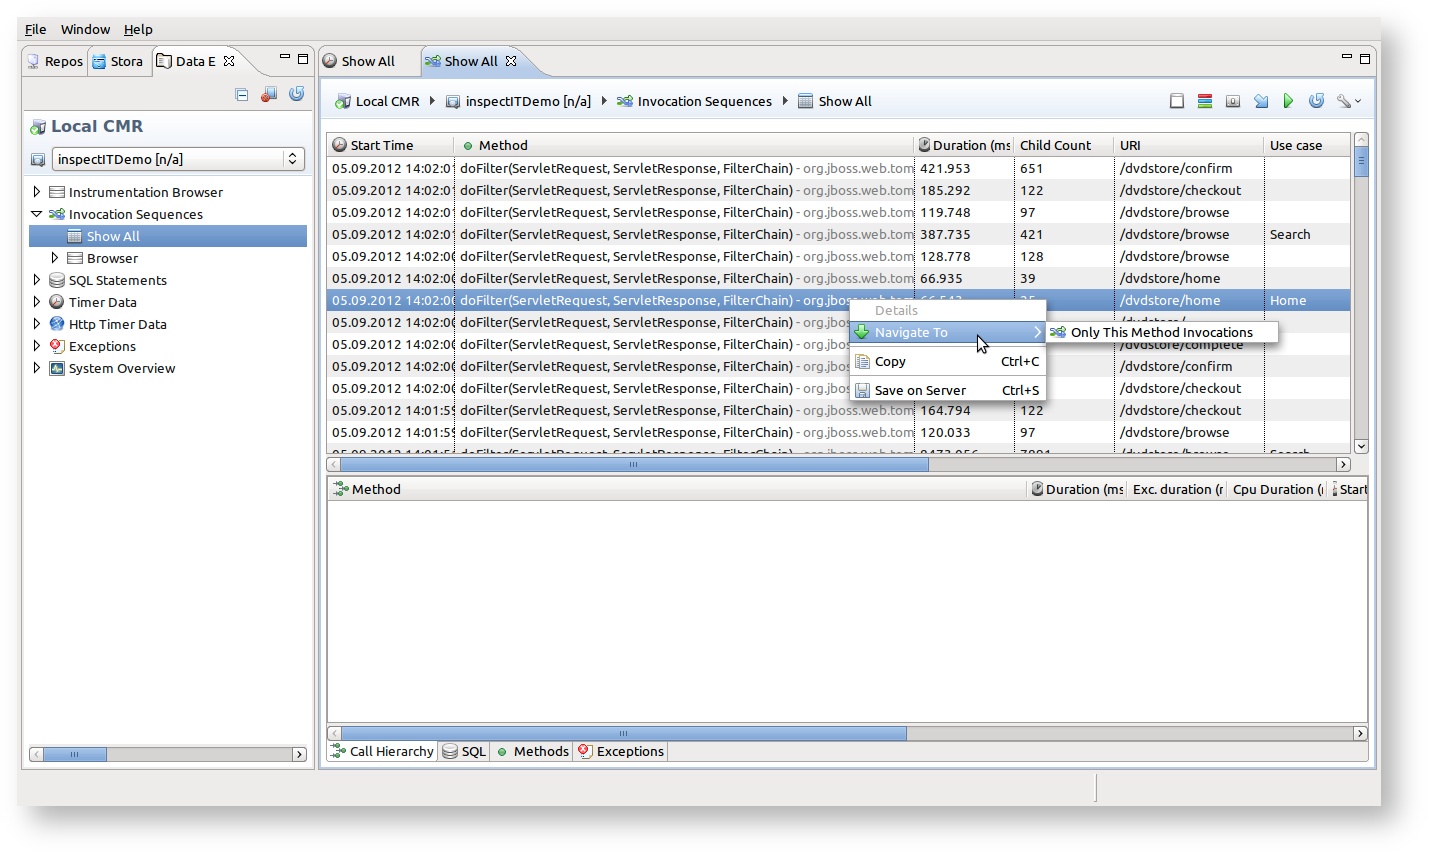
Only this Method Invocations
With this option, you can filter the invocation sequence overview to just show these selected methods. A new view will be opened with this filter being applied. This provides useful if the overview shows several different methods as the starting point for the invocation sequences and you are just interested in a specific one. Option is available under Navigate To -> Only This Method Invocations in right-click menu.
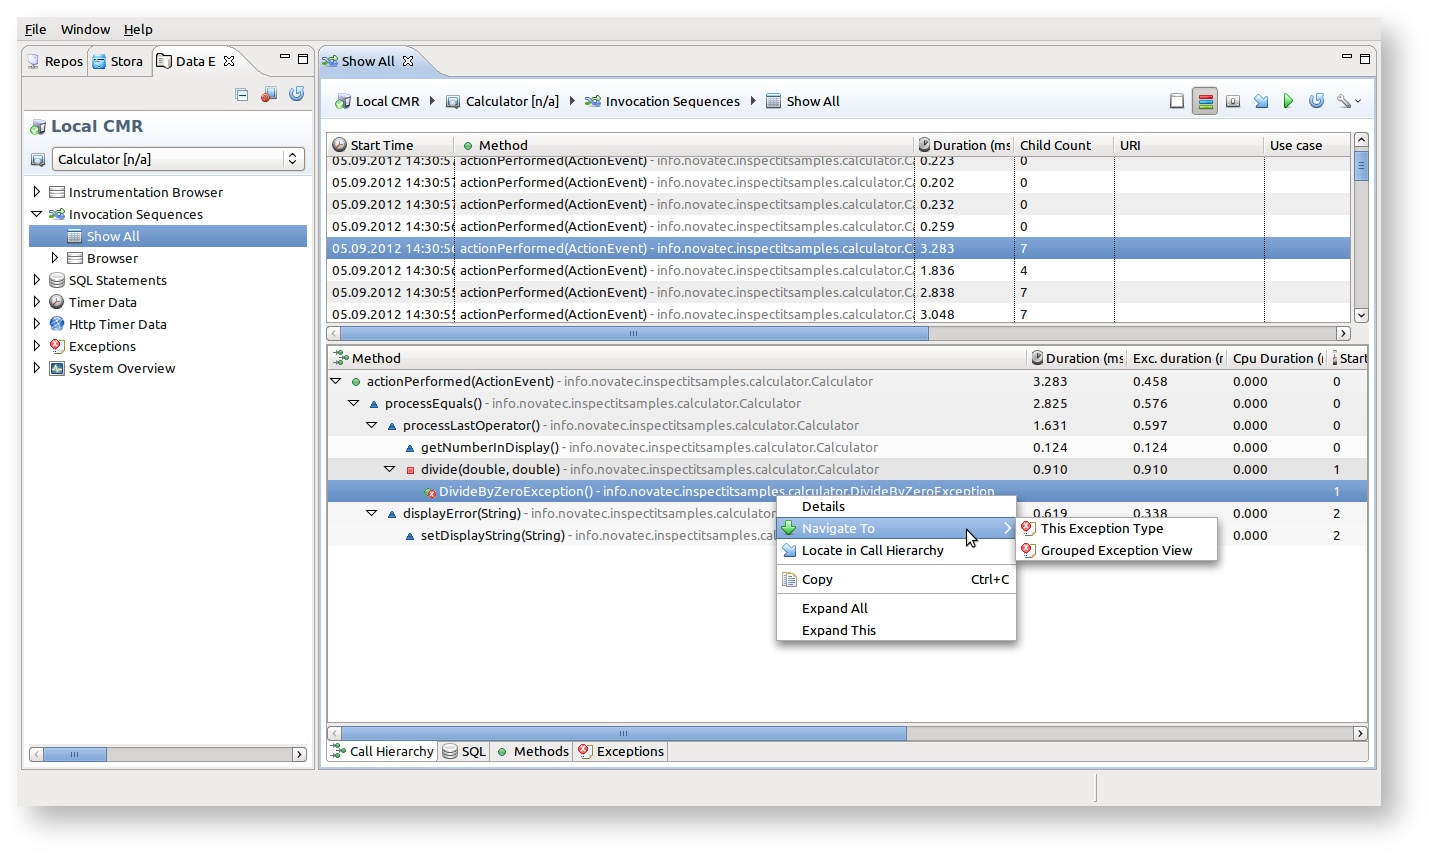
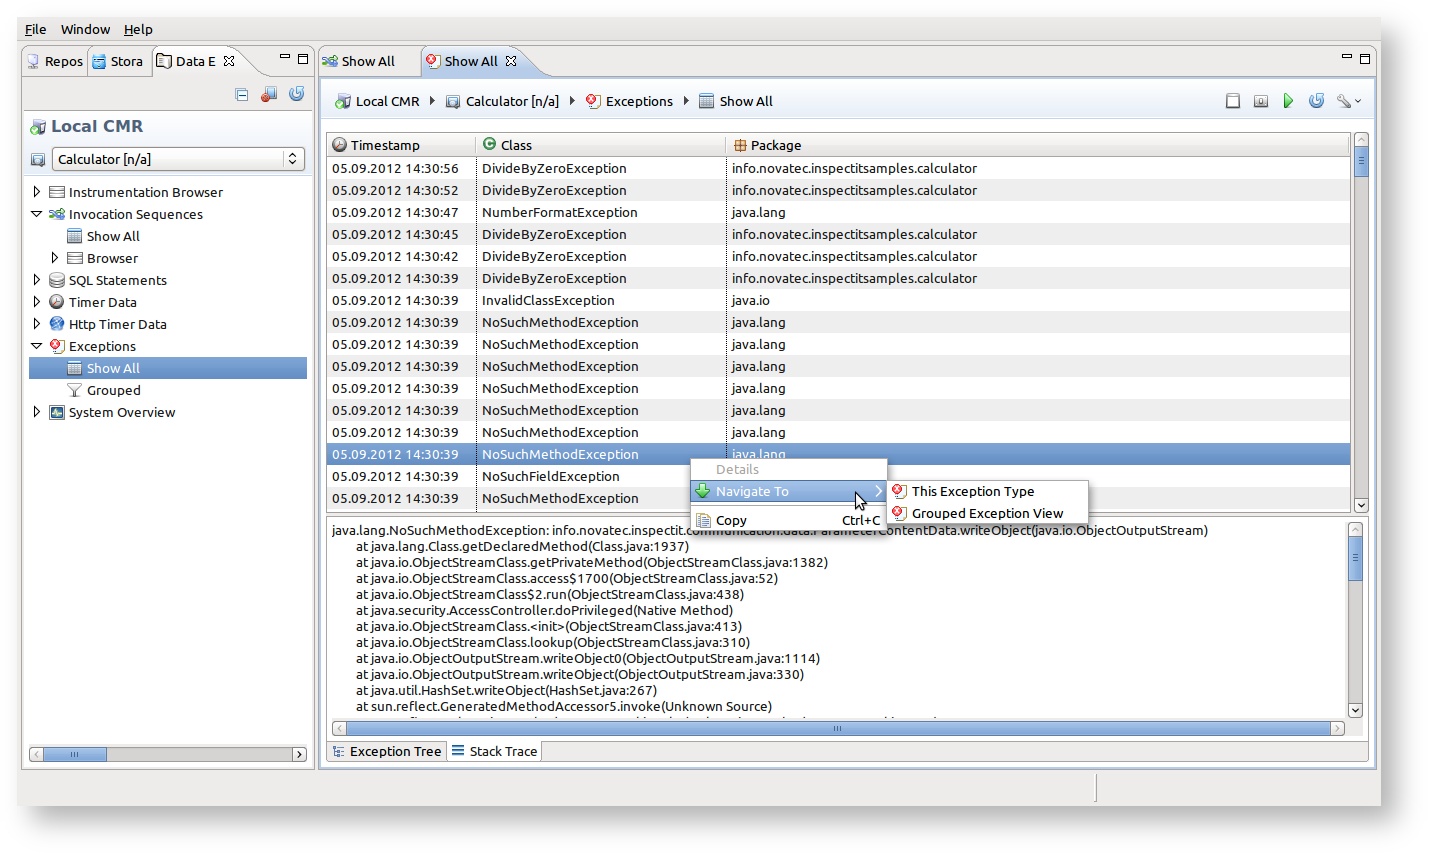
Navigate to Exception Type / Grouped Exception View
Every view that displays some information about the Exceptions that occurred provides two navigation possibilities. The Navigate To ->  This Exception Type will open the Exception Sensor view filled with only selected exception type. On the other hand, the Navigate To -> Grouped Exception View will open the mentioned group view also filtered to show only selected exception type. Note that these navigation possibilities are available also from inside exception views.
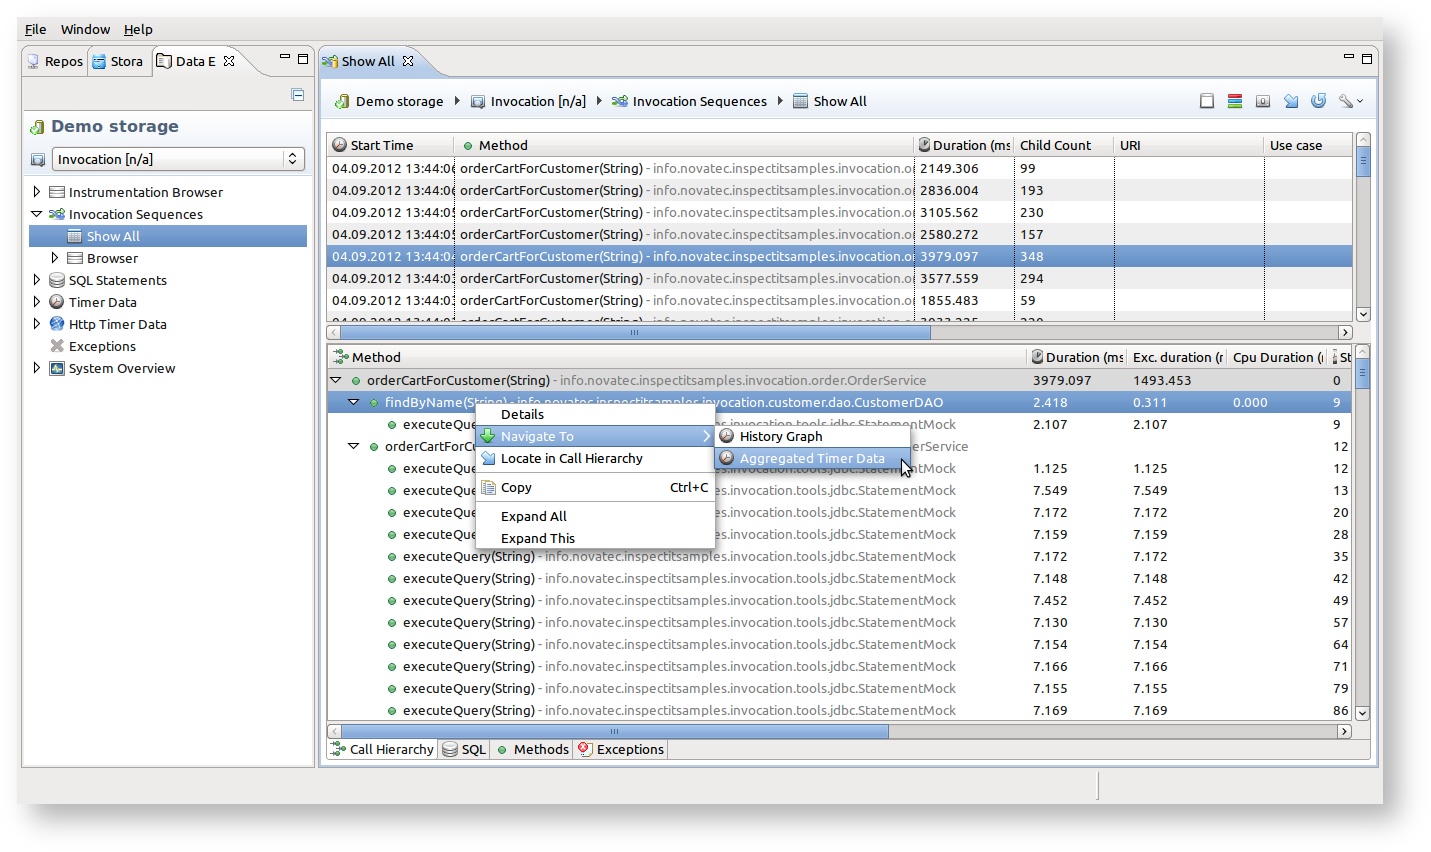
Navigate to aggregated Timer / SQL views
From any SQL statement or method execution information it is possible to open the related aggregated view and display wanted SQL / method. This action is important in situations when in a single invocation execution the user locates the problematic SQL / method and is interested to see what performance results the selected item has in general. The option is available under Navigate To -> Aggregated Timer Data and Navigate To ->  Aggregated SQL Statement.
Stepping
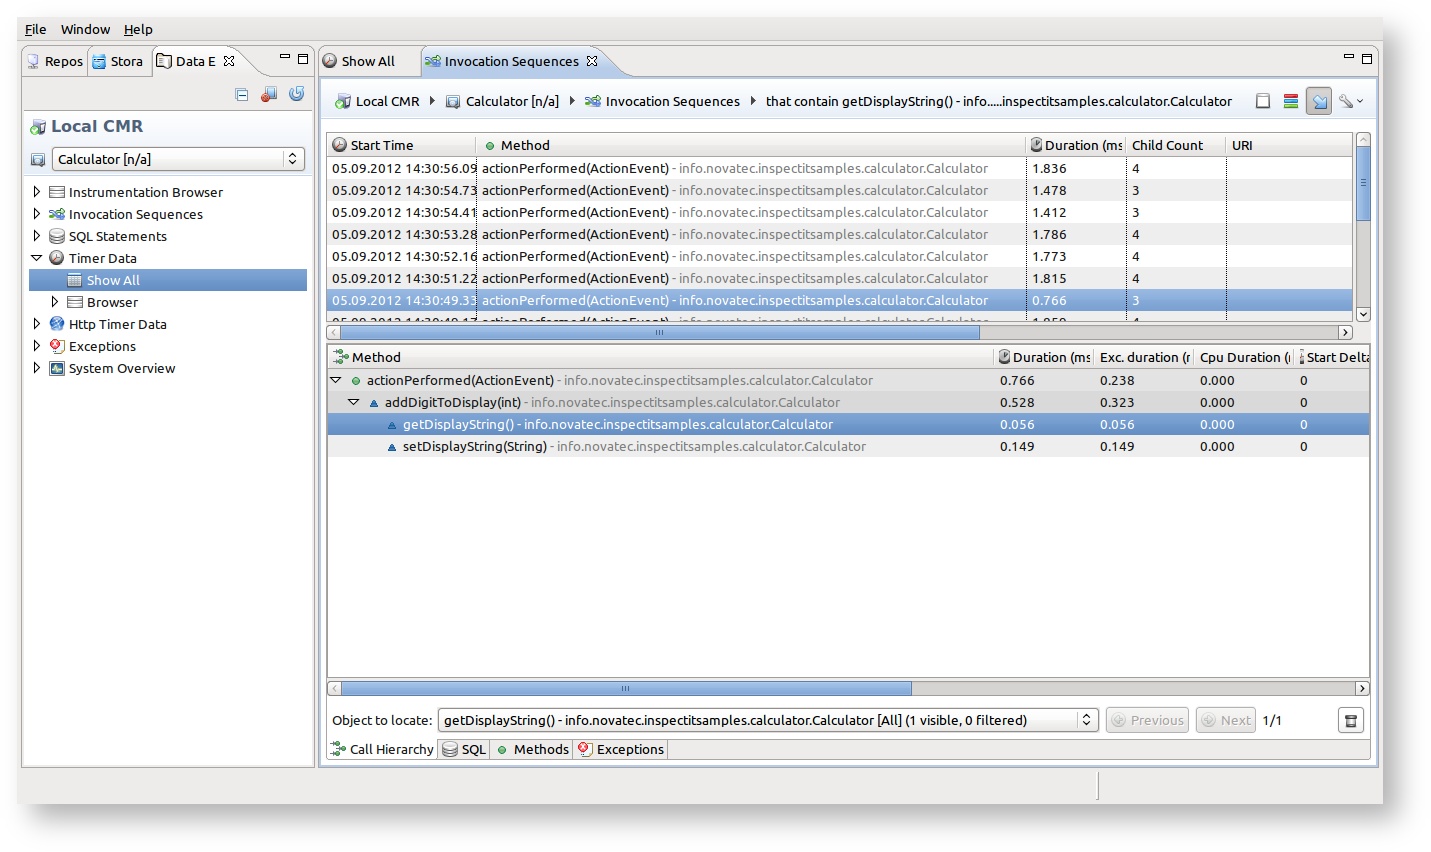
Auto-stepping
After executing the Navigate To Invocations action, the Invocation view is opened with additional widget at the bottom of the view that provides the stepping functionality. The stepping widget enables locating of previously selected navigation base elements in the invocation tree. From the combo box, different elements can be selected and with buttons Next/Previous occurrences of the element can be located in the invocation. The widget also informs the user about the total number of occurrences that can be located.
The stepping widget can be closed/reopened in the view menu (located on the top right corner).
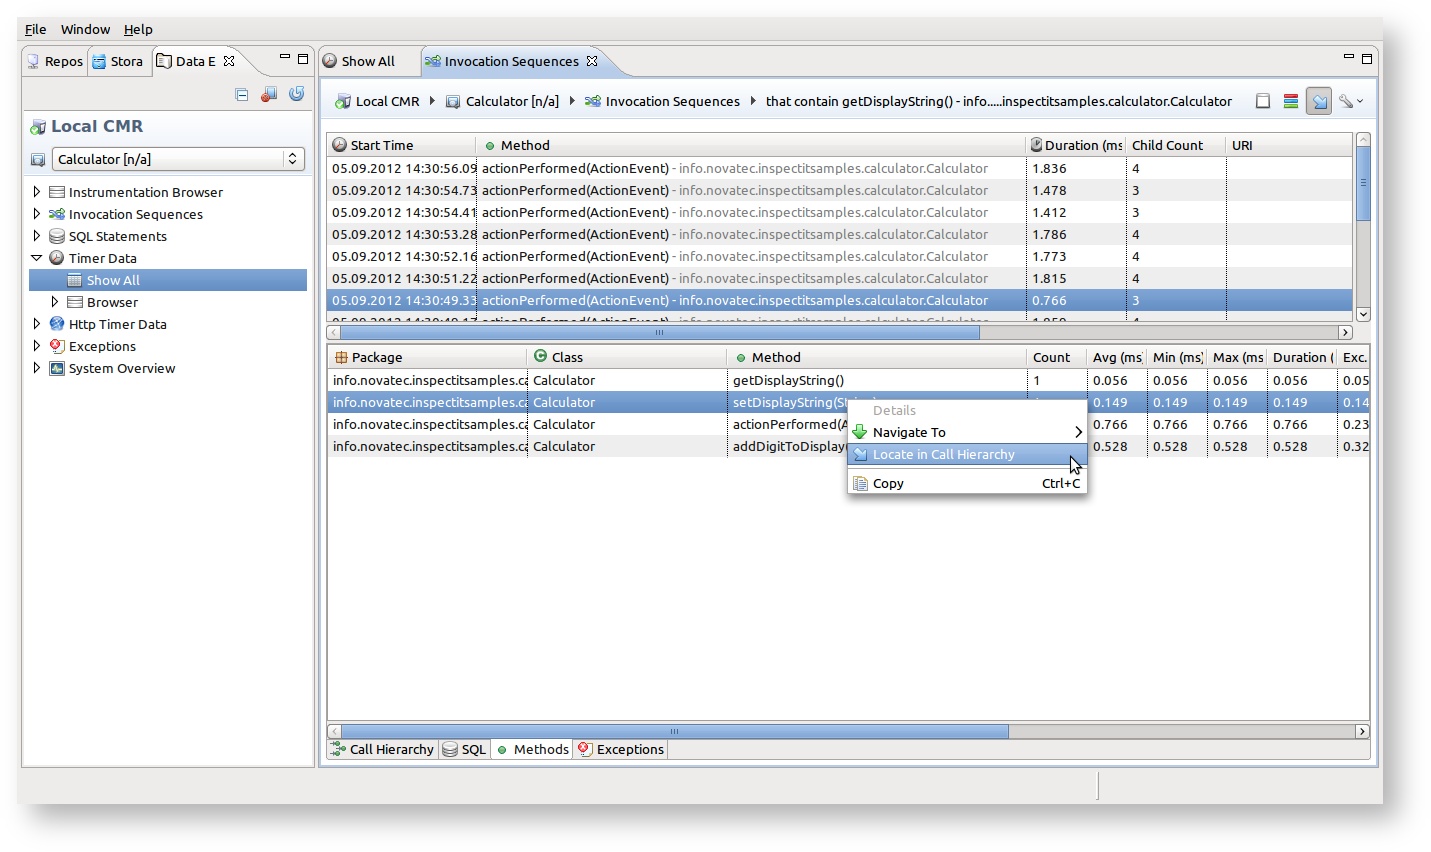
Locate in Call Hierarchy
The stepping functionality is from version 1.2.2 available also from the basic Invocation Sequence View. Now it is easy to locate any object in the call hierarchy. From the tabbed views "SQL", "Methods", "Exceptions" (see picture) a user can right click on any, for example, SQL Statement and by clicking on "Locate in Call Hierarchy" immediately see it occurrences directly in the call hierarchy of the currently opened invocation.