Working with the HTTP sensor
- Copy Space for Confluence
Available with version 1.3
Understanding the HTTP Timer
The HTTP timer view thus provides you with interesting starting points for monitoring and diagnosis if you dealing with a webbased application. Instead of methods of classes you can see the aggregated timings and calling frequency of the webpages of your application.
The HTTP sensor extends the functionality of the Timer sensor with HTTP based information. Where Timers measure method execution times, the HTTP Timer measures the execution time of a webbased request. It is important to understand that the HTTP sensor will only provide one measurement per request. That means that even if you attached the HTTP sensor to multiple methods within the execution of a request only the first invocation (that provides Http information) is measured. This is done to allow for easier analysis in the aggregation views. Think of the aggregation based on the requested URI. You might want to count the number of requests that the user had to a given URL, but this is only possible if we ensure that only one metric is captured for each request, right?
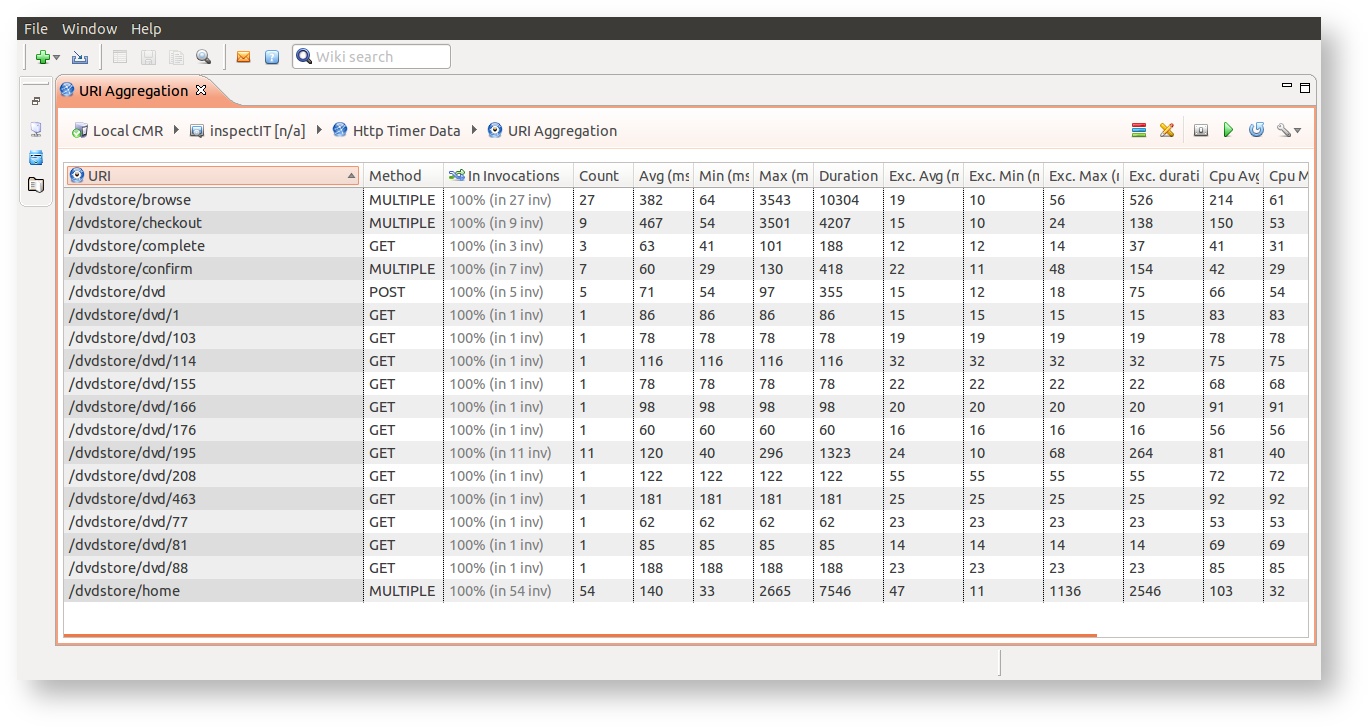
URI Aggregation
The URI based aggregation shows all current HTTP Timers that are available in the buffer (see Working with the in-memory storage) aggregated by the URI of the request. Note that you see only one metric is recorded per request, so the provided count is the number of distinct requests.
Just like a common Timer, the HTTP Timer in this aggregated view can easily be navigated to get a detailed view of all invocation sequences that contain requests to this URI. You can use this functionality to easily analyze these requests. It is also a great functionality for analyzing the one request that took significally longer than the rest.
Adjustable time resolution
For the better overview, all the times in aggregated view like this one are presented in milliseconds, without decimal places. However, you can also display the decimal places if the higher resolution is needed. Use the view menu in top-right corner and select desired value in the "Decimal places" group.
Regular expression URI transformation
from version 1.5
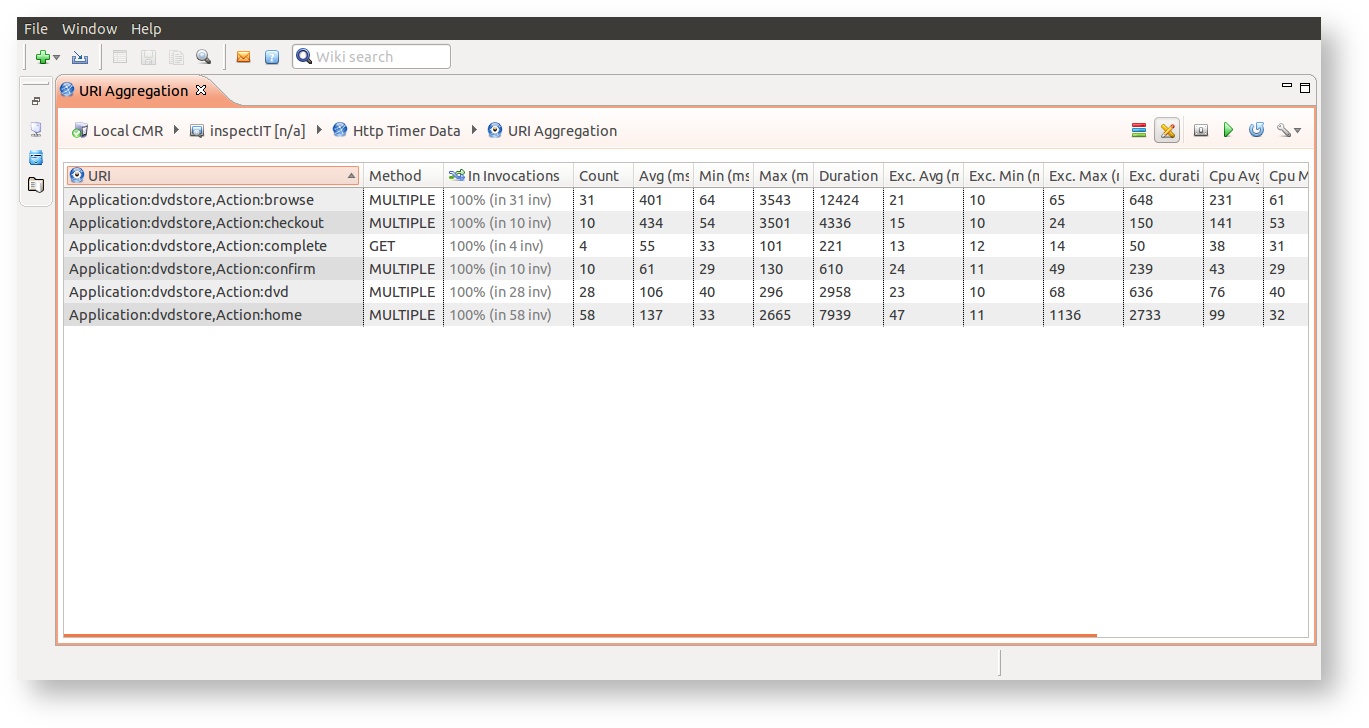
Since often different URIs represent the same action, inspectIT bring the possibility to define the regular expression and regular expression template that can be used to transform the URIs. Please read the Http Sensor for information on how to correctly define these in the HTTP sensor definition.
If the regular expression is defined for the HTTP sensor, the URI Aggregation  view menu will have the Apply sensor regular expression on URI
  option visible. By enabling it, all the URIs will be transformed:
| URis | Transformed URIs with regular expression |
|---|---|
 |  |
Sensor configuration
The transformation example displayed in the two images above was achieved by defining the following HTTP sensor configuration:
method-sensor-type http info.novatec.inspectit.agent.sensor.method.http.HttpSensor MAX regEx=/([\w]+)/([\w]+).* regExTemplate=Application:$1$,Action:$2$
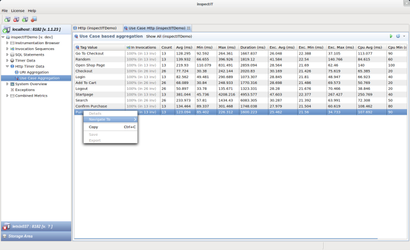
Use case Aggregation
HTTP Timers can also be aggregated on different information than their URI. With the Use Case Aggregation the HTTP Timer Data is aggregated based on the value of a given HTTP Header. If you are using a load testing tool you might want to integrate this specific header (called "inspectit") and add a meaningful value that describes the current step in your use case in more detail.
In the inspectIT DVD Store sample application we could integrate the "inspectit" header to get a more detailed overview of what use case we are currently executing. So in fact the screenshot you see below is based on the same data as in the URI Aggregation. It is just a matter of perspective :)
Adjustable time resolution
For the better overview, all the times in aggregated view like this one are presented in milliseconds, without decimal places. However, you can also display the decimal places if the higher resolution is needed. Use the view menu in top-right corner and select desired value in the "Decimal places" group.
Loading data from a specific time-range
HTTP views enables a user to specify a time-range that the displayed data should be in. By clicking to the  icon the time-range selection opens, where you can select the wanted time-range for displayed data. Note that the entered duration will be relative to the selected until date. Selecting duration of one hour to the current time, will display the data that was collected in the last hour.

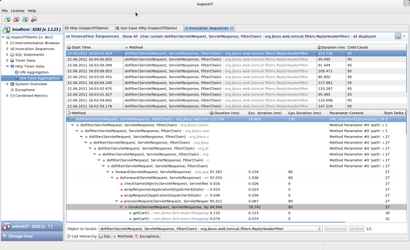
Detailed analysis in invocation sequences
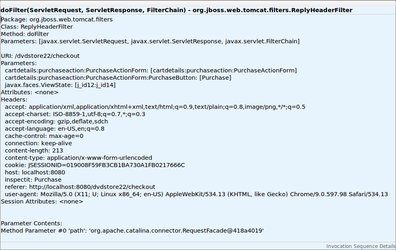
All HTTP Timer are also automatically integrated in invocation sequences. Here the HTTP Timer will provide detailed information about the HTTP parameter, attributes, headers, ... that this request sent to your application. Notice that the URI of the request is provided in the parameter column of the invocation sequence. If you right-click an element and select "Details" you will see more information about the element. If this element provided a URI, then you will see additional HTTP information.
|
|
|
|
|
Charting of the HTTP data
from version 1.5
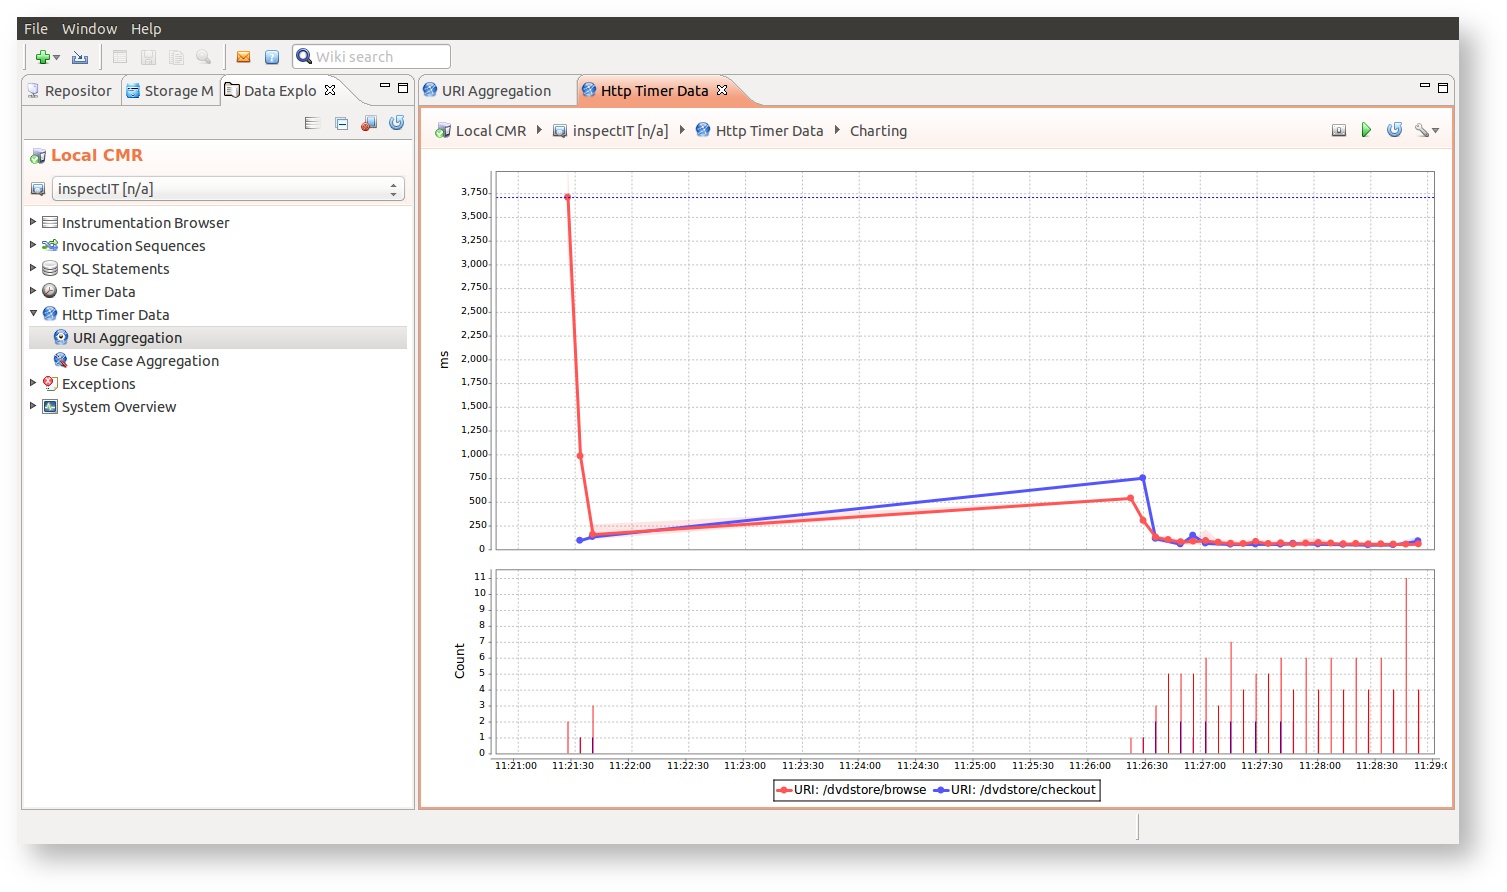
If the Charting Option is activated for the HTTP sensor assignments, the HTTP data will be considered as long-term data. This enables the HTTP data also to be displayed in charts.
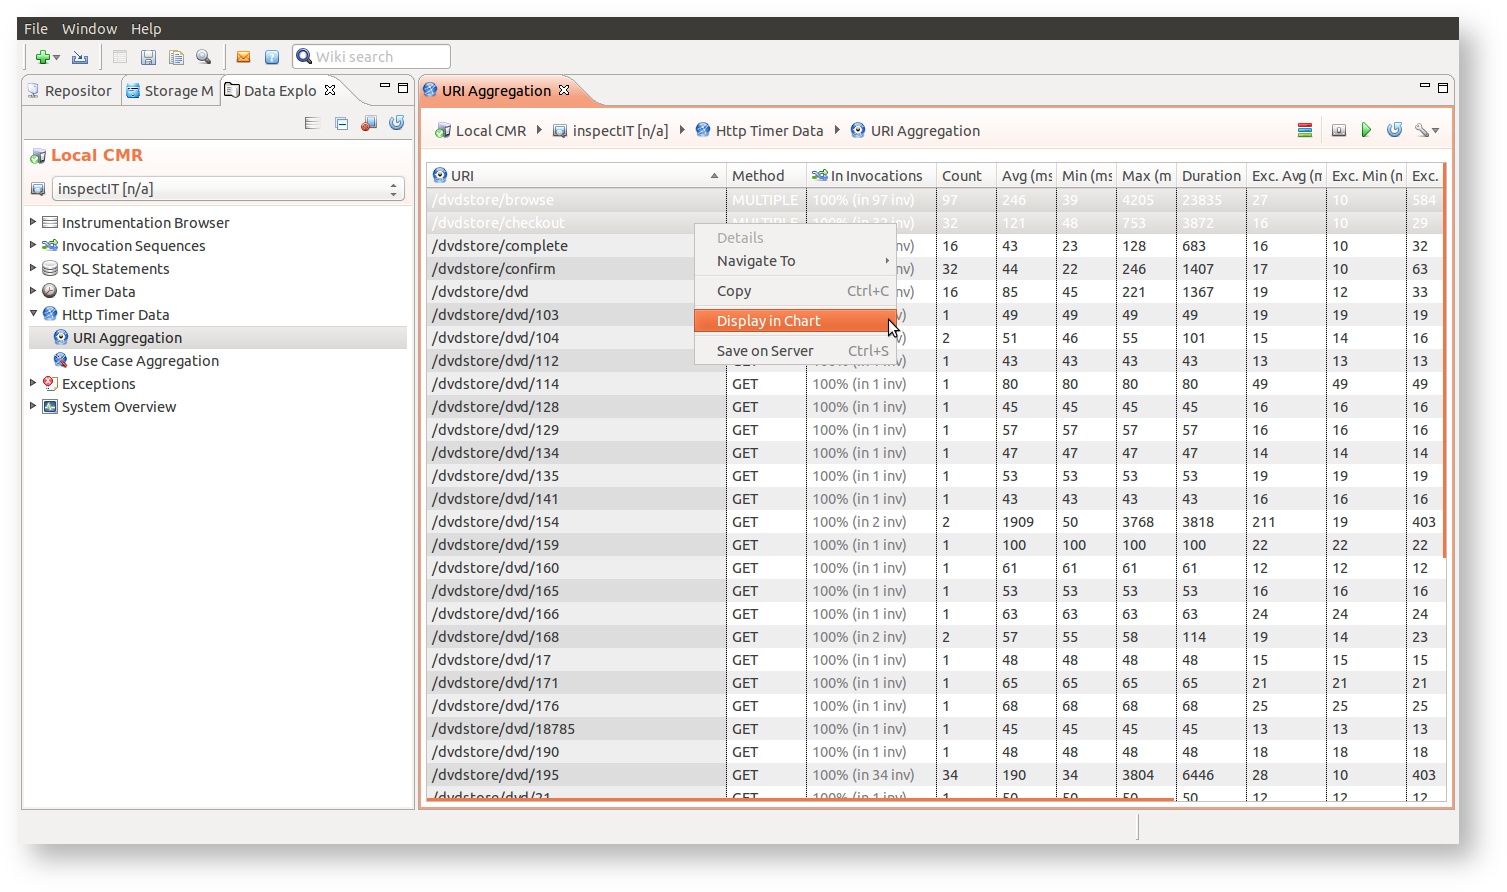
The chart with the HTTP data can be created from both URI Aggregation and Use case Aggregation views. HTTP data that have the Charting Option activate will be marked with the  icon. A right-click on one or more URI or Use case entries will open the right-click menu offering the 'Display in Chart' option. Click on this option will open the chart in new window.
The page Viewing historical data provides additional information on how to control the displayed historical data.