Data Explorer View
- Copy Space for Confluence
The data explorer view is the view that enables the user to perform the analysis of the gather monitoring data. This view is automatically opened on the left side of inspectIT UI when the user double-clicks on the Repository/Agent in the Repository Manager View or Storage in the Storage Manager View. The user can freely re-position or close the view. To reopen the view again, please go to the Main Menu -> Window -> Show View -> Data Explorer or double-click again on the wanted data source.
The view always shows which Repository/Storage is explored and which Agent on this Repository/Storage is currently being shown in the tree.


As described above, this view show the monitoring data tree. This tree was already existing in the older versions of inspectIT, but from version 1.4, the tree only show one Agent data. The source of the data can be either the CMR Repository or Storage. In both case, each can have more than one Agent registered. To switch from a different Agents that are belonging to the same Repository or Storage use the combo box under the name of the repository.
Last selected agent
The inspectIT will save the last explored Agent in the data explorer view and will try to display that Agent on the next start-up (if the Agent is available).
Show/Hide inactive instrumentations
from version 1.5
One of the biggest flaws of the instrumentation browser in the Data Explorer View prior to version 1.5 was inability to display inactive instrumentations after the agent reconnects to the CMR with changed configuration. It s absolutely expected that during the performance diagnose amount of monitored methods/classes is changed and now it is possible to distinguish between currently active and inactive ones.
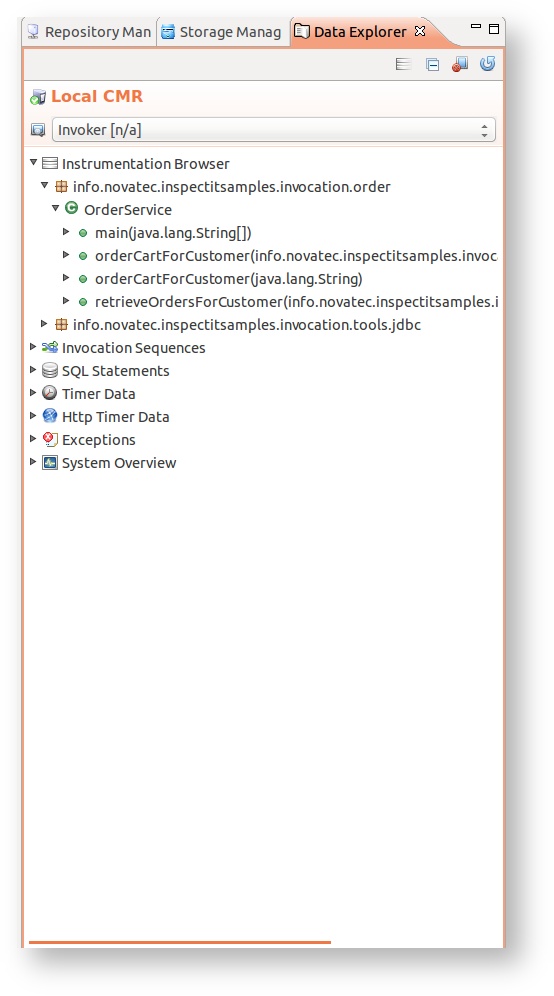
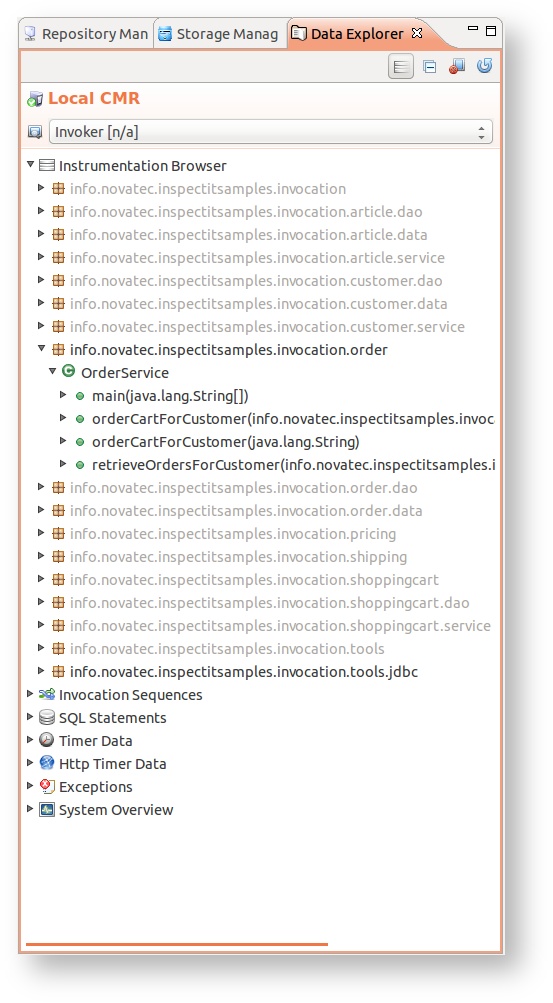
With the new feature the Data explorer view will show only the currently active instrumentations by default. To display methods/classes that are currently not instrumented, but have been in past, enable the Show inactive instrumentation  option in the view top menu. The inactive methods/classes/packages will appear gray, but opening of the sensors related to them can still be executed.
Here is the screen shot describing the differences when inactive instrumentations are shown/hidden:
| Hide inactive | Show inactive |
|---|---|
 |  |