Working with the JMX sensor
- Marius Oehler
- Ivan Senic
From version 1.6.6.
Description
The JMX Sensor is used to gather several information provided by the Java Management Extenstion (JMX). This information is represented by objects called MBeans (for Managed Bean) which can contain any kind of information (e.g.: system-load, up-time, thread-count, classes loaded, server-version, ...).
Configuration
For a detailed instruction about the configuration of the JMX sensor see Agent Configuration: Sensor type definition.
The User Interface
For the basic usage of the user interface see UI Basics.
If a JMX sensor was properly configured an item named JMX Data containing a bean icon  will be shown in the data explorer view (see Data Explorer View for more information). This item contains two further items called Show all and Browser. By double-clicking the Show all item an overview of all monitored MBean attributes will be opened. A structured tree-representation of the monitored attributes is located under the data explorer view item Browser by which particular attributes can be accessed directly.
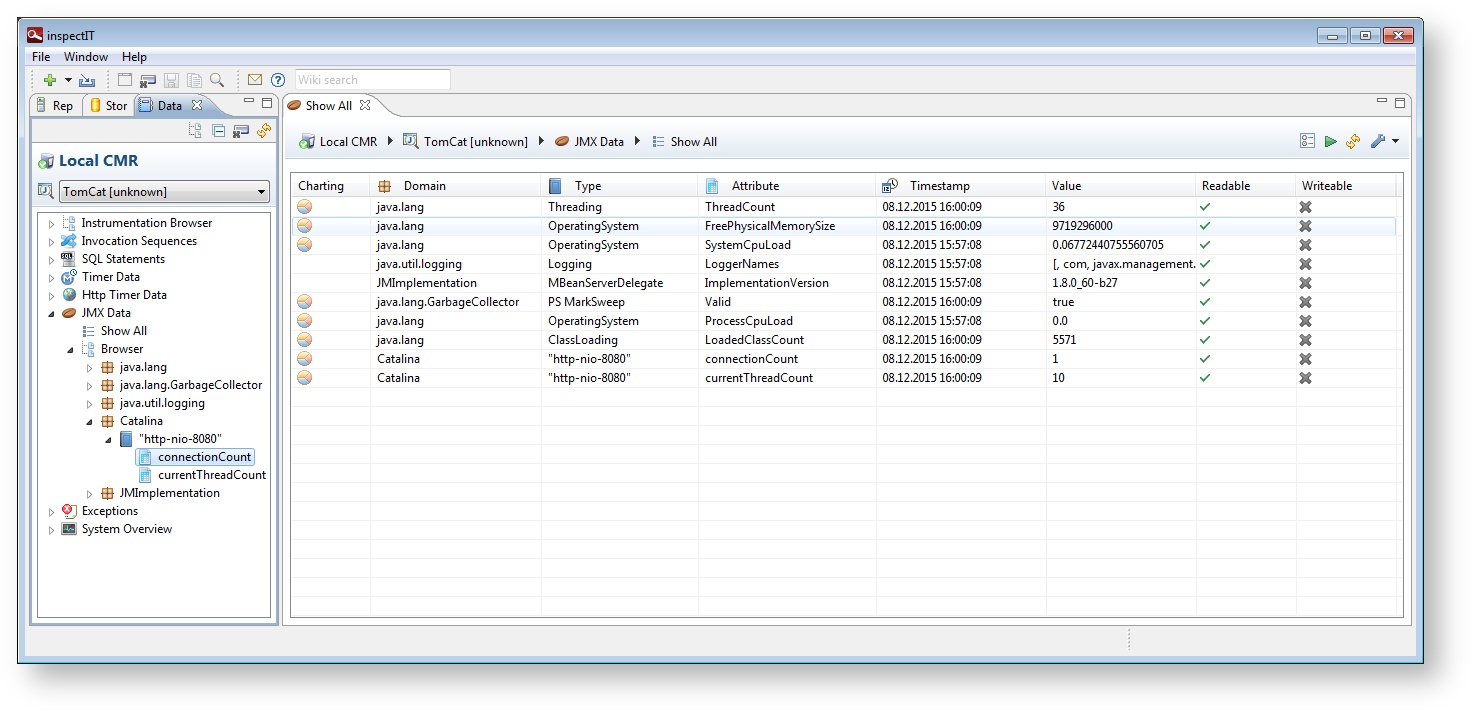
The center view contains an overview of all monitored MBean attributes and associated information. It is important to note that only the latest value of each MBean is shown. This is also the case if a time range was defined, then, the latest value in this time range will be shown.
MBean attribute values can be charted if its value is a numerical value or a Boolean expression (true, false, yes, no). A attribute can be charted if the respective row of the Charting column contains the chart icon  .
.
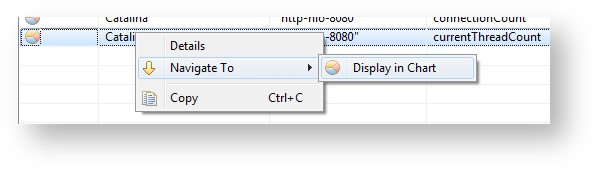
To chart an MBean attribute, open the context menu on the desired entry and click on Display in Chart located in the Navigate To menu. See Charting of the JMX Data for detailed information about charting.
Charting of the JMX Data
For the basic usage of graphs see Working with graphs and Viewing historical data.
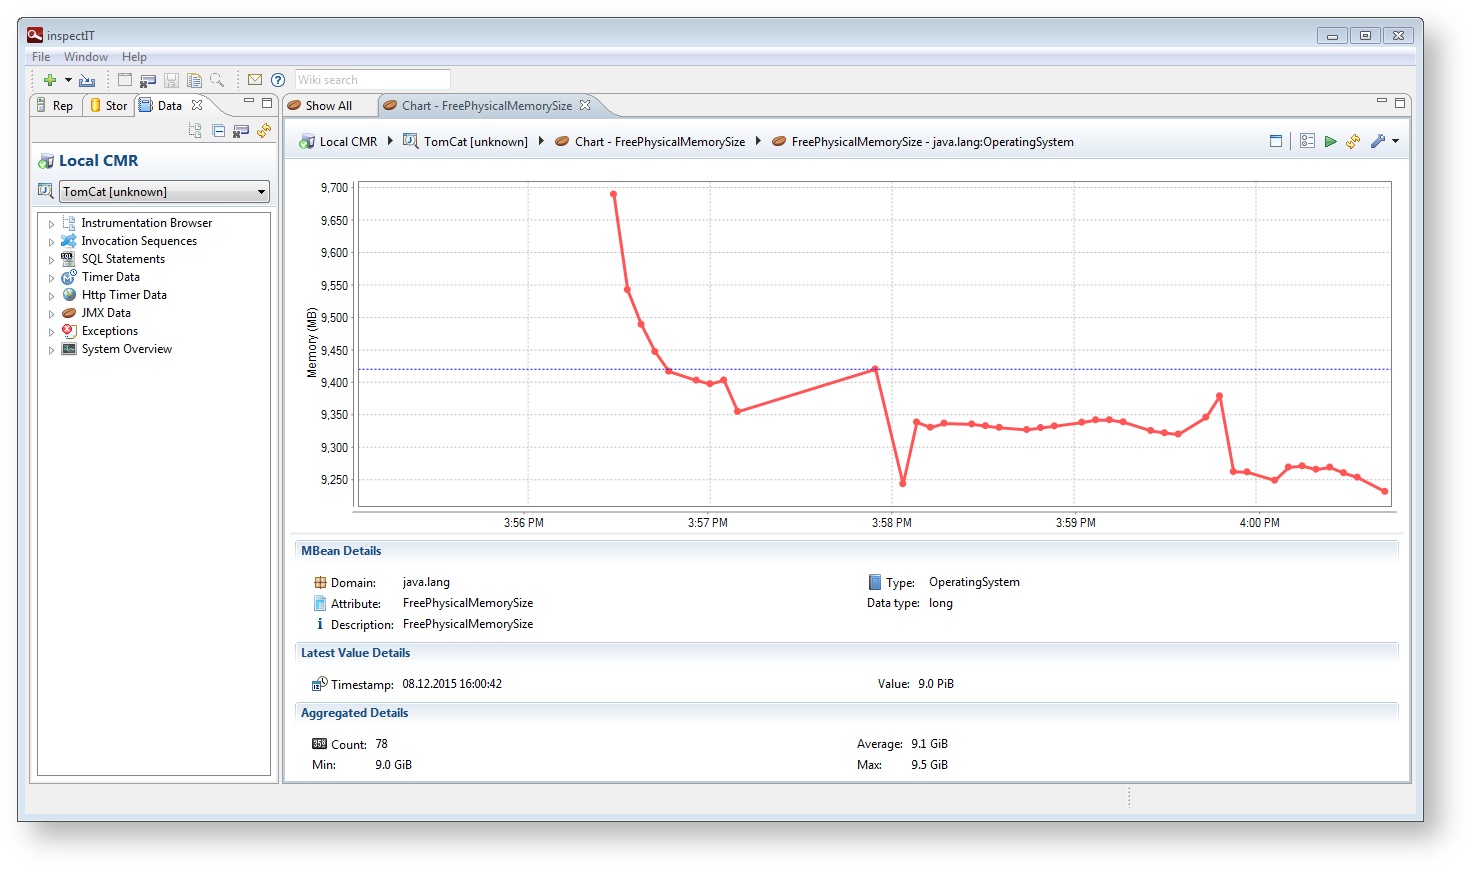
The charting view comprises two parts. It is the chart itself which is located in the upper part and an area containing information about the charted MBean attribute located in the lower part of the view. The information in the lower part should be self-explanatory.
Due to the fact that a MBean attribute can contain any possible data it is sometimes necessary to set a appropriate plotting type otherwise the chart can be difficult to interpret. The type can be changed in the Plot as.. menu located under the Preferences icon in the upper right corner of the view. The correct plotting type will be set automatically for many common MBean attributes.
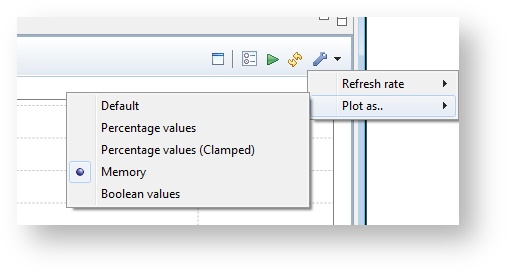
The following table contains a description of each available plotting type.
| Type | Description |
|---|---|
| Default | The values will be plotted without any adaption. |
| Percentage values | The values are interpreted as a percentage value (1 = 100%). |
| Percentage values (Clamped) | The values are interpreted as percentage values. The range is between 0 (0%) and 1 (100%). Values outside of this range are aligned to the limits. |
| Memory | The values are interpreted as a byte count. |
| Boolean values | The values are interpreted as binary values (1 (true) or 0 (false)). |