Working with the SQL Browser
- Copy Space for Confluence
The SQL Browser provides information about all SQLs that were executed on the system. SQLs are separated by the database they were executed on. SQLs having the same signature are aggregated. The aggregation of the SQLs uses concrete parameters if the SQL parameter capturing is enabled. More information about SQL parameter capturing can be found here. The SQL browser should be used to get a quick overview of the SQL queries that are executed in the system under diagnosis.
Auto-refresh imposes very high system load
Activating auto refresh for the SQL browser view creates a very high system load on the CMR. This is due to the fact that the CMR needs to aggregate each and every SQL in memory and sent them to the client. Thus the analyst should uses manual refreshing.
Adjustable time resolution
For the better overview, all the times in aggregated view like this one are presented in milliseconds, without decimal places. However, you can also display the decimal places if the higher resolution is needed. Use the view menu in top-right corner and select desired value in the "Decimal places" group.
View organization
The improved SQL view in inspectIT is now divided into two parts and allows to aggregate based on the combination of bind variables. The upper part displayed the basic aggregation of metric data per SQL, including the SQL query and isPrepared flag. The SQLs are separated by the database they were executed on, with the view displaying the database URI, type and version. The bottom part displays the aggregation per distinct bind value combination within the selected query in the upper part. In addition to that the bottom part displays the complete SQL query string based on the binded values combination.
This aggregation per distinct bind value helps a lot as often a query is only slow if certain parameters are passed to it. Using the new SQL analysis view you can easily drilldown from the aggregation of a generic SQL to the concrete aggregations for a specific set of parameters. In addition you can also easily copy the SQL including the parameters and execute the statement yourself or give it to your DBA for closer examination.
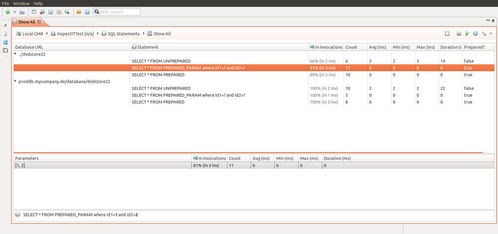
The Parameters table will be filled on the double-click in the Statement table only if the selected SQL statement is prepared and it has at least one parameter.
Usage examples
Finding slow queries
Queries having slow average response times often indicate one of the following:
- (unnecessary) complicated SQL query structure
- integration of aggregation functions that prevent the database from using meaningful indexes
- Missing indexes on the database
To find these types of SQL queries simply sort the queries by average time in the SQL browser.
Finding queries that are invoked very often
In most cases it is not necessary for the application to invoke one query multiple times. Often application-side or ORM caching is not activated or configured badly. Often the developer is not even aware that certain SQLs are invoked very often and that caching might be meaningful.
To find these queries simply sort the queries by count in the SQL browser.
Finding queries that take most time
In each application there are queries that take some time. Usually for search dialogs where the number of input is very high, not all queries can be optimized. Usually these queries are no performance problem as they are called only seldom.
A very meaningful information is the total duration of one SQL query. This "duration" can be used to see which query created overall the most load on the system.
Detailed analysis
Usually the SQL browser provides a birds eye view on the SQLs of the system. For a deeper analysis, the analyst usually uses invocation sequences to see which database queries were executed within with call.
Loading data from a specific time-range
This view enables a user to specify a time-range that the displayed data should be in. By clicking to the  icon the time-range selection opens, where you can select the wanted time-range for displayed data. Note that the entered duration will be relative to the selected until date. Selecting duration of one hour to the current time, will display the data that was collected in the last hour.
