Working with the Instrumentation Browser
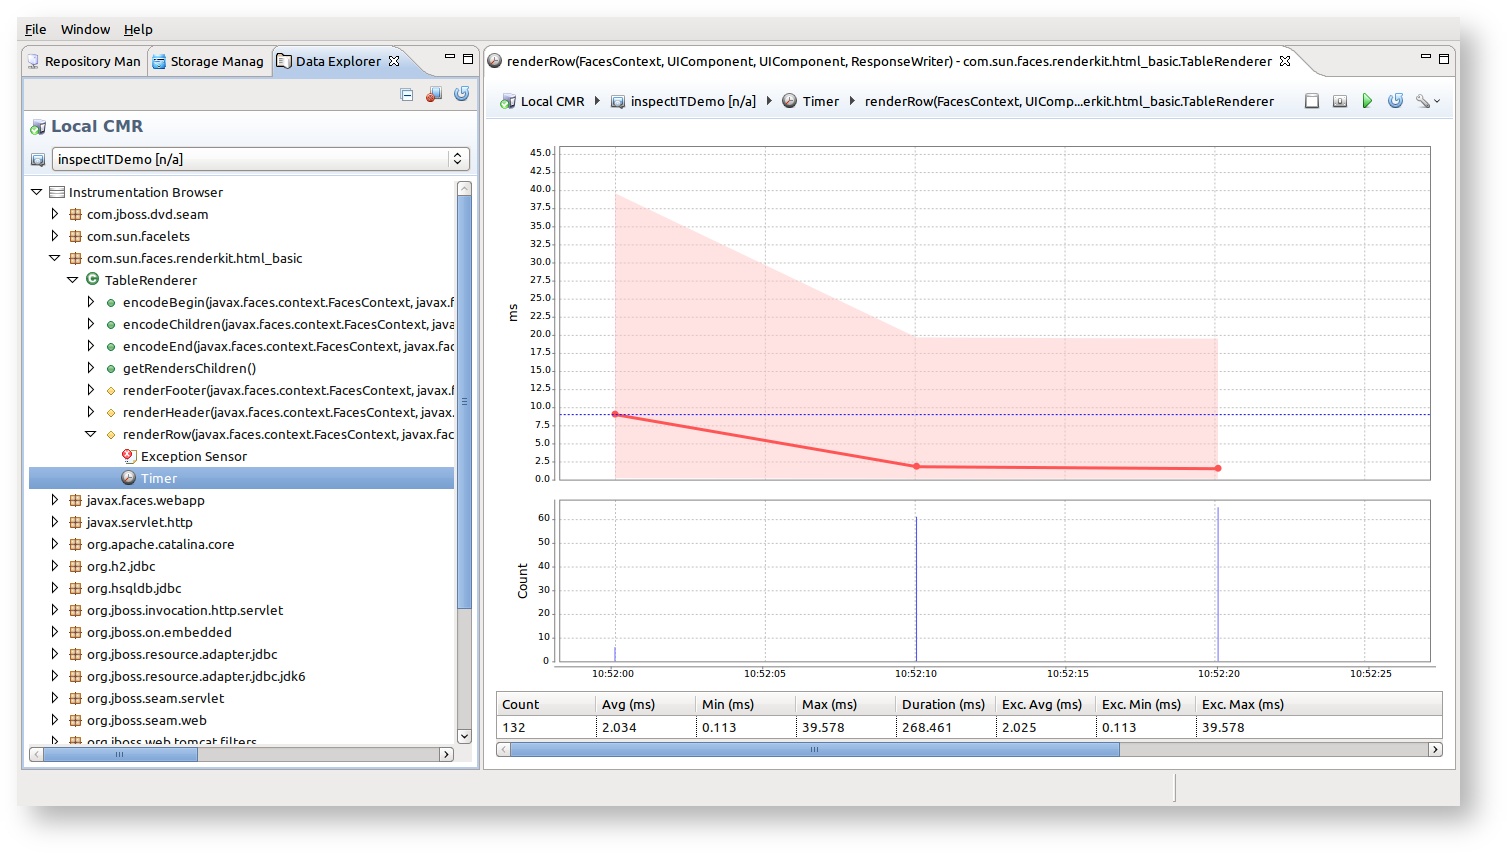
The instrumentation browser lists all currently instrumented classes and their methods using a simple tree structure.
Inspecting currently instrumented classes
Due to the way how inspectIT uses the classloading to instrument classes (see Overview for more details), you only see your instrumentations if the class is in fact loaded (in most cases this happens when the class is used first by the application - exceptions are for example preloading of classes by an application server). The currently loaded classes that are shown in the instrumentation browser are not refreshed automatically. In order to refresh them, the "Refresh Repository" button above the CMR panel must be used.
There are many reasons to use the instrumentation browser:
- Check if a certain class is already loaded and its instrumentation is active (e.g. check if your database sensor is active)
- See all instrumented sensors for one class/method and open it in the detail view by double-clicking.
Opening sensor details for instrumented method
Using the instrumentation browser, the analyst can open any sensor configured for a method by double-clicking it.
Show/Hide inactive instrumentations
from version 1.5
One of the biggest flaws of the instrumentation browser in the Data Explorer View prior to version 1.5 was inability to display inactive instrumentations after the agent reconnects to the CMR with changed configuration. It s absolutely expected that during the performance diagnose amount of monitored methods/classes is changed and now it is possible to distinguish between currently active and inactive ones. Please refer to the Data Explorer View for more information on this topic.
