Working with the Exception sensor
Description
The Exception Sensor is used to gather information about caused exceptions in an application.
Configuration
The Exception Sensor type is a method-based sensor type, but the definition is slightly different to common method-based sensor types like Timers. For detailed information about the configuration and the performance impact see the Exception Sensor configuration.
Visualization
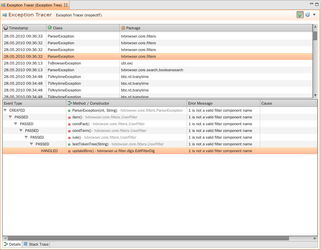
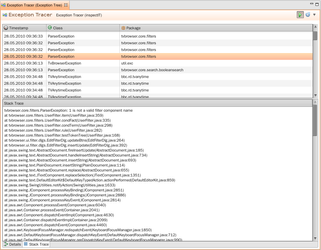
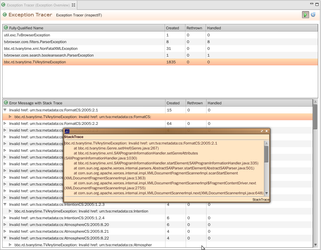
In the below picture you can see how the Exception Sensor is represented in the User Interface. Currently there are two different analysis views which can be selected. The element Show All shows all Exceptions in an ungrouped way over time and allows a tree-like analysis of each Exception. The Show All view makes it also possible access the stack trace of a specific exception. In the Grouped view you get an overview over different exceptions that are grouped together with the respective event types. No time information is shown in this view. See the below table to get a detailed description about the views provided in the UI regarding the Exception Sensor.
Visualization | Screenshot (click to enlarge) | Description |
|---|---|---|
Show All |
| Gives an overview of which exceptions were caused within the application in an ungrouped way over the time. This means that each exception is shown separately. You have the possibility to get more information about a single exception by double-clicking on it. The information shown in the below part of this view depends on which tab you selected (Exception Tree or Stack Trace). Within the Exception Tree tab you can see a whole exception tree with all recorded event types. This enable you to analyze exactly in which method/constructor a certain event happened. By selecting the StackTrace tab you can analyze the stack trace of the selected exception. |
Grouped |
| Gives an overview of which exceptions were caused within the application and how often a specific event type was triggered. Exceptions of the same type are grouped in this view and no time information are shown. By double-clicking on a specific exception you will get all error messages that were used for this exception. Furthermore you can analyze which stack traces were generated based on a particular error message. This gives you a deep insight of what happed within the application. |