Working with invocation sequences
- Copy Space for Confluence
What are invocation sequences
The invocation sequences are container that collect data from all other sensors being invoked by the method (and sub-methods) the invocation sequence sensor is defined on. The invocation sequence sensor thereby collects the exact order of the sensors being invoked and does not (like most other sensors) aggregate information. Thus the invocation sequence sensor can provide the exact traversal of all methods (and timings if timer sensors are defined) of a certain method. Using invocation sequences inspectIT can be used to trace user transactions. For more information see the configuration of the invocation sequence sensor
Description
This sensor works quite different than all other ones as only the entry method of the invocation sequence sensor is specified.
The invocation sequence sensor will collect the detailed data (no aggregation is done) of all sensors being defined within the specified method (and all submethods). Even if sensor of a method called within the invocation sequence will normally provide an aggregated value, this sensor will be stored with the concrete data that was recorded during this invocation. Thus for each invocation, the data each sensor provides is captured, allowing the user to inspect each invocation independently of all other invocations.
Note that the invocation sequence is not only applicable to timer information (although this might often be the most important information), but captures the values of all sensors. Thus the invocation sequence also automatically provides information about SQL statements being executed (in the case that the SQL sensor is enabled) or of an Exception Sensor. The invocation sequence sensor is capable of capturing all information that all possible sensors provide.
It goes without saying that an invocation sequence sensor set on a method having no other sensors defined either directly or within its submethods will not provide any values at all. (except the information that the invocation was started and ended sometime, thus it will be displayed in the invocation sequence view in the UI)
Context
Invocation sequences can also contain the application's context by integrating parameter contents (For more detail see Context Capturing). Utilizing this functionality allows the analyst to have additional information at hand in case a problem occurs.
Application area
The invocation sequence sensor can be used for example in the following application areas:
- Methods that perform slow infrequently as the invocation sequence sensor will provide all invocations independent of each other and thus allows the user to find the slow running method invocation.
- It is useful to see how a call traverses a (sub-)system in order to find problems and bugs or to verify the correct behavior.
- Inspecting the method flow during development
- inspecting if a defined architecture is really used by the developers
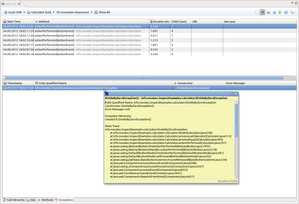
Icons
The icons within the call tree visualization provide additional information about what happened. The basic icons provide the method visibility (according to Eclipse style: green = public, blue = protected, red = private). In addition to that certain overlays provide additional information. Currently only exception tracing information are provided. The red cross indicates an exception being thrown, the blue triangle indicates an exception being catched and rethrown and the yellow exclamation mark indicates the handling of an exception (it goes without saying that these icons are only available if the Exception Sensor is activated).
![]()
Visualizations
Invocations Overview
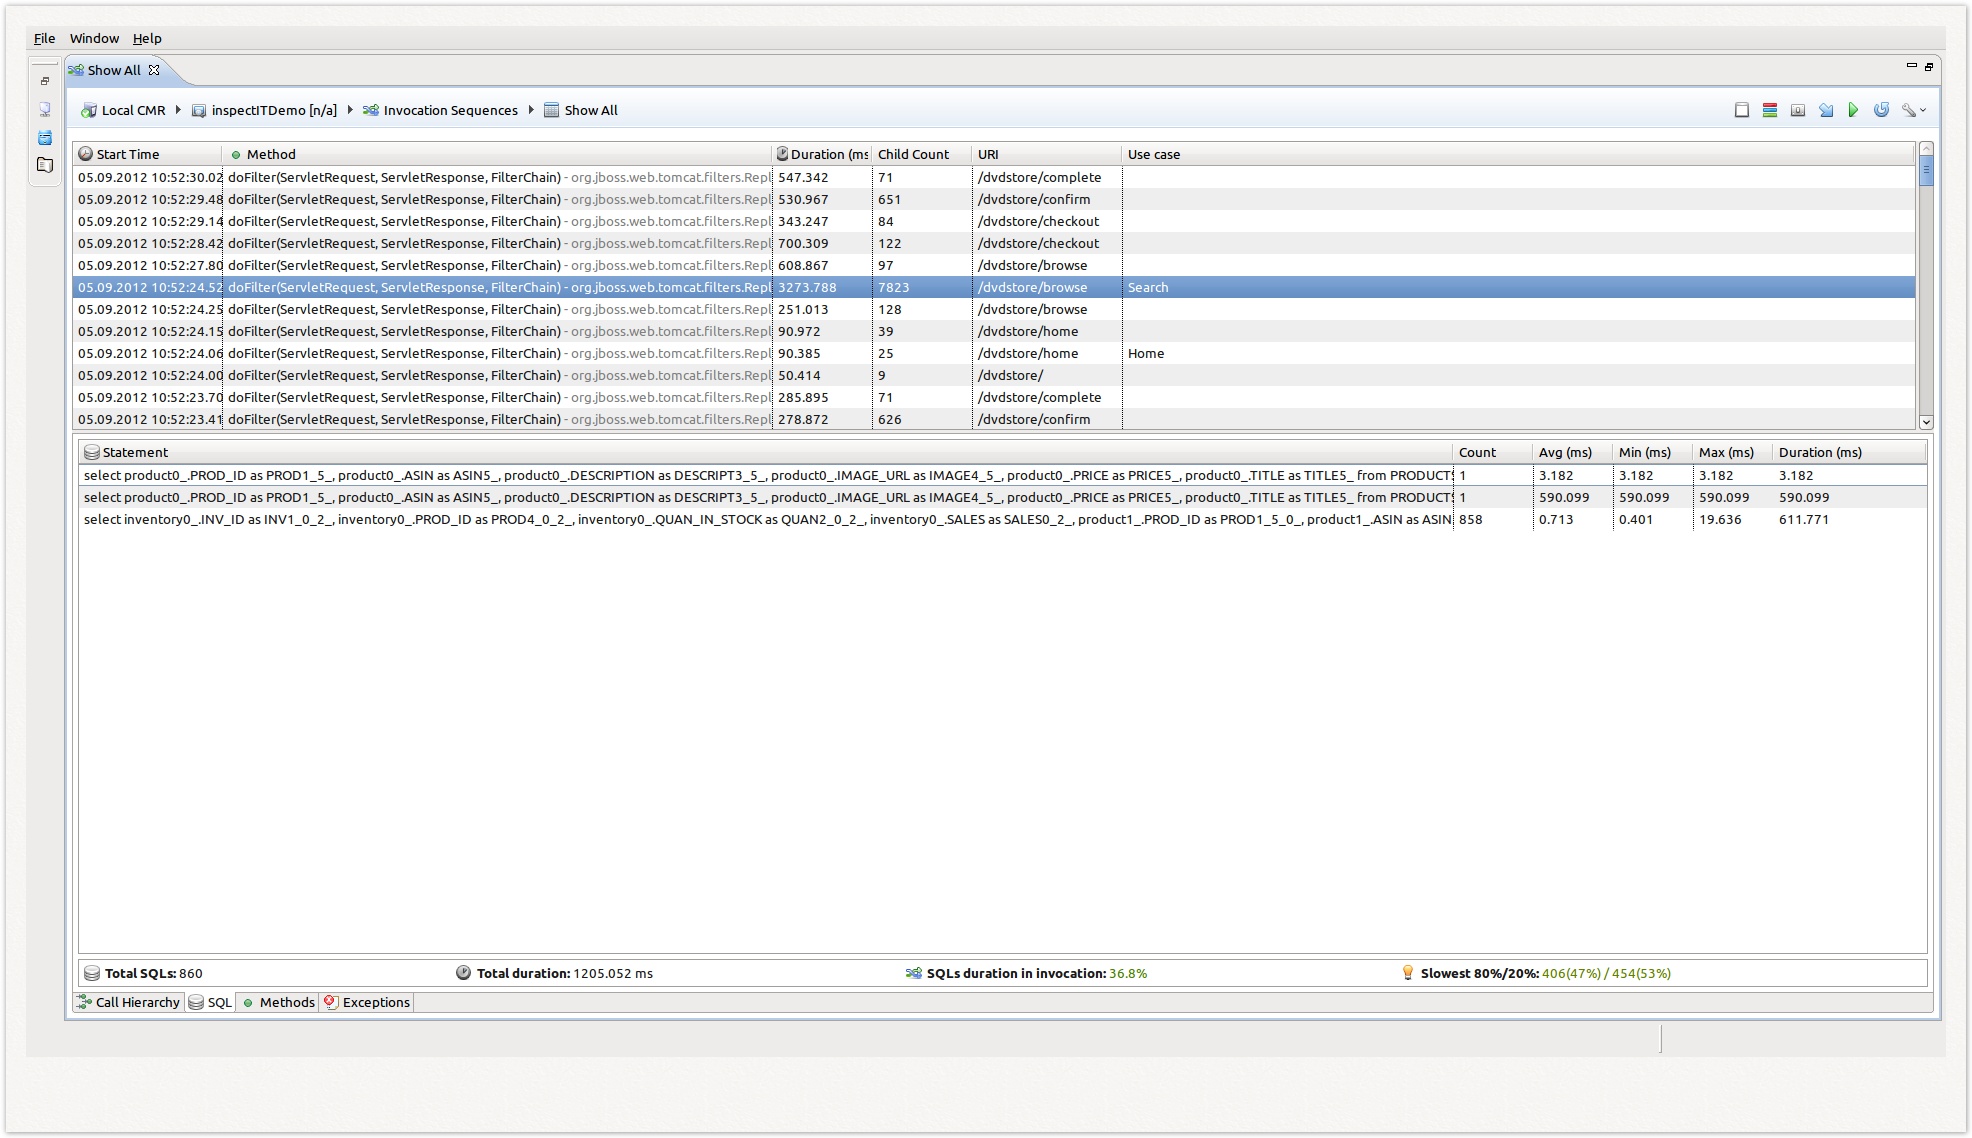
The invocation overview can be opened by choosing the  Invocation Sequences ->
  Show All menu item in the agent tree displayed in the Data Explorer View. The overview shows all invocations for the chosen agent, unless the option Item count to show is set to a fix amount. This and other options for the view can be changed in
  Preferences menu in the top-right corner of the view.
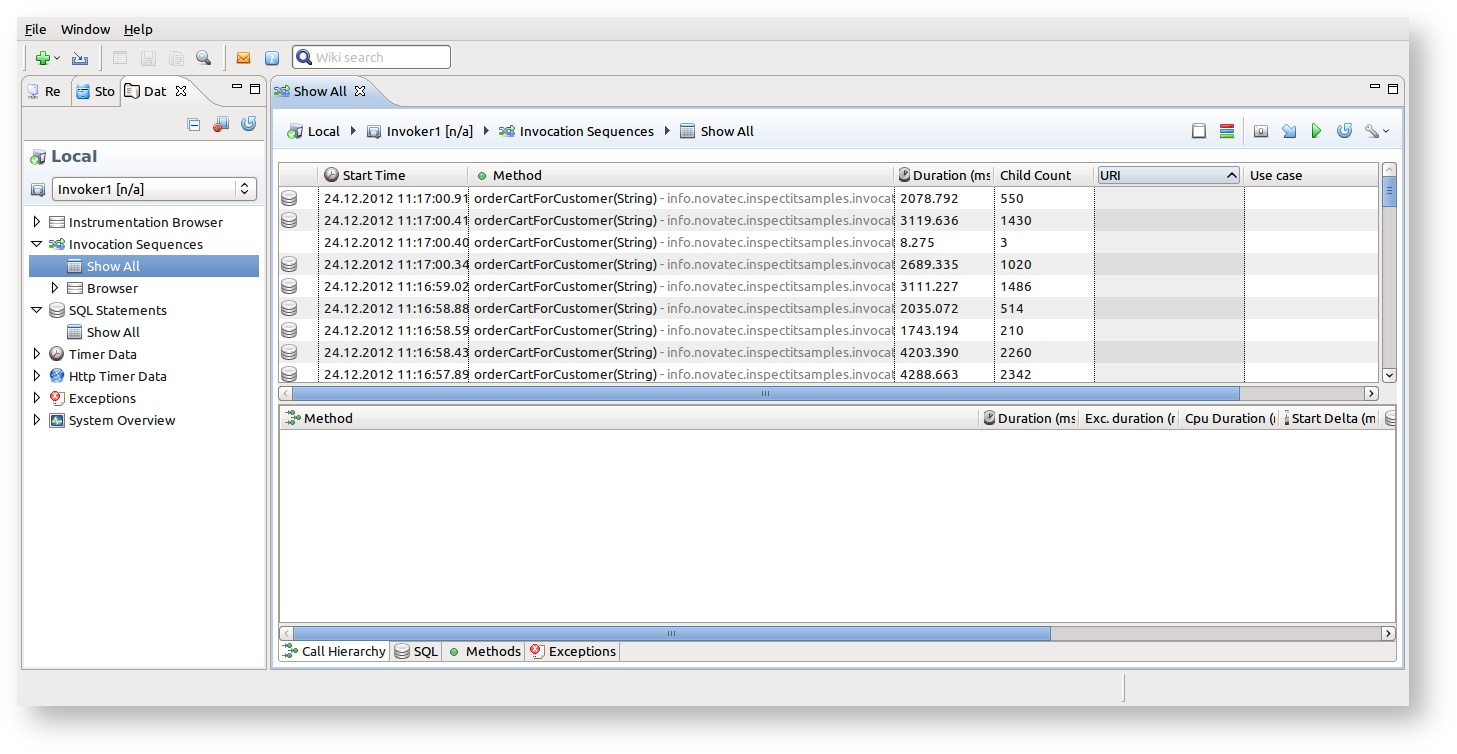
In the overview table, the basic information for each invocation can be read, like the start time of the invocation, method that is representing the entry point, duration or children count. If the invocation is part of the HTTP request, the correct URI that started the invocation will also be displayed. Furthermore, if the HTTP request was tagged with the inspectit header (see Working with the HTTP sensor) then the use-case that invocation represents will also be displayed.
In the first column of the overview table there is additionally the information if the invocation is containing any SQL Statements or Exceptions as children. This will be represented with the icon  for the SQL Statements and icon
  for the Exceptions. No icon means that the invocation had no SQL executed and no Exception raised during execution. Note that this only correlates to the used instrumentation and does not mean that the invocation in real execution did not had mentioned events.
Single Invocation Views
The user interface provides different reprensentations of invocation sequences.
Visualisation | Screenshot (click to enlarge) | Description | Use for | Requires | Since | ||||||||||||
|---|---|---|---|---|---|---|---|---|---|---|---|---|---|---|---|---|---|
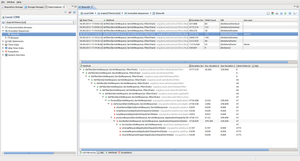
Call tree view |
| The call tree representation of an invocation sequence provides the exact call hierarchy within the invocation sequence. The start of the tree is the entry method (the method the invocation sequence is defined on). The next level of the tree provides all methods that we called directly by the entry method. The order of the calls is exactly the same as the application did the calls within this invocation (note that only methods are shown that are instrumented - not instrumented methods are obviously not shown!). |
| Suitable instrumentation of sub methods with timer sensors | 1.0 | ||||||||||||
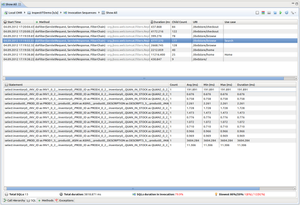
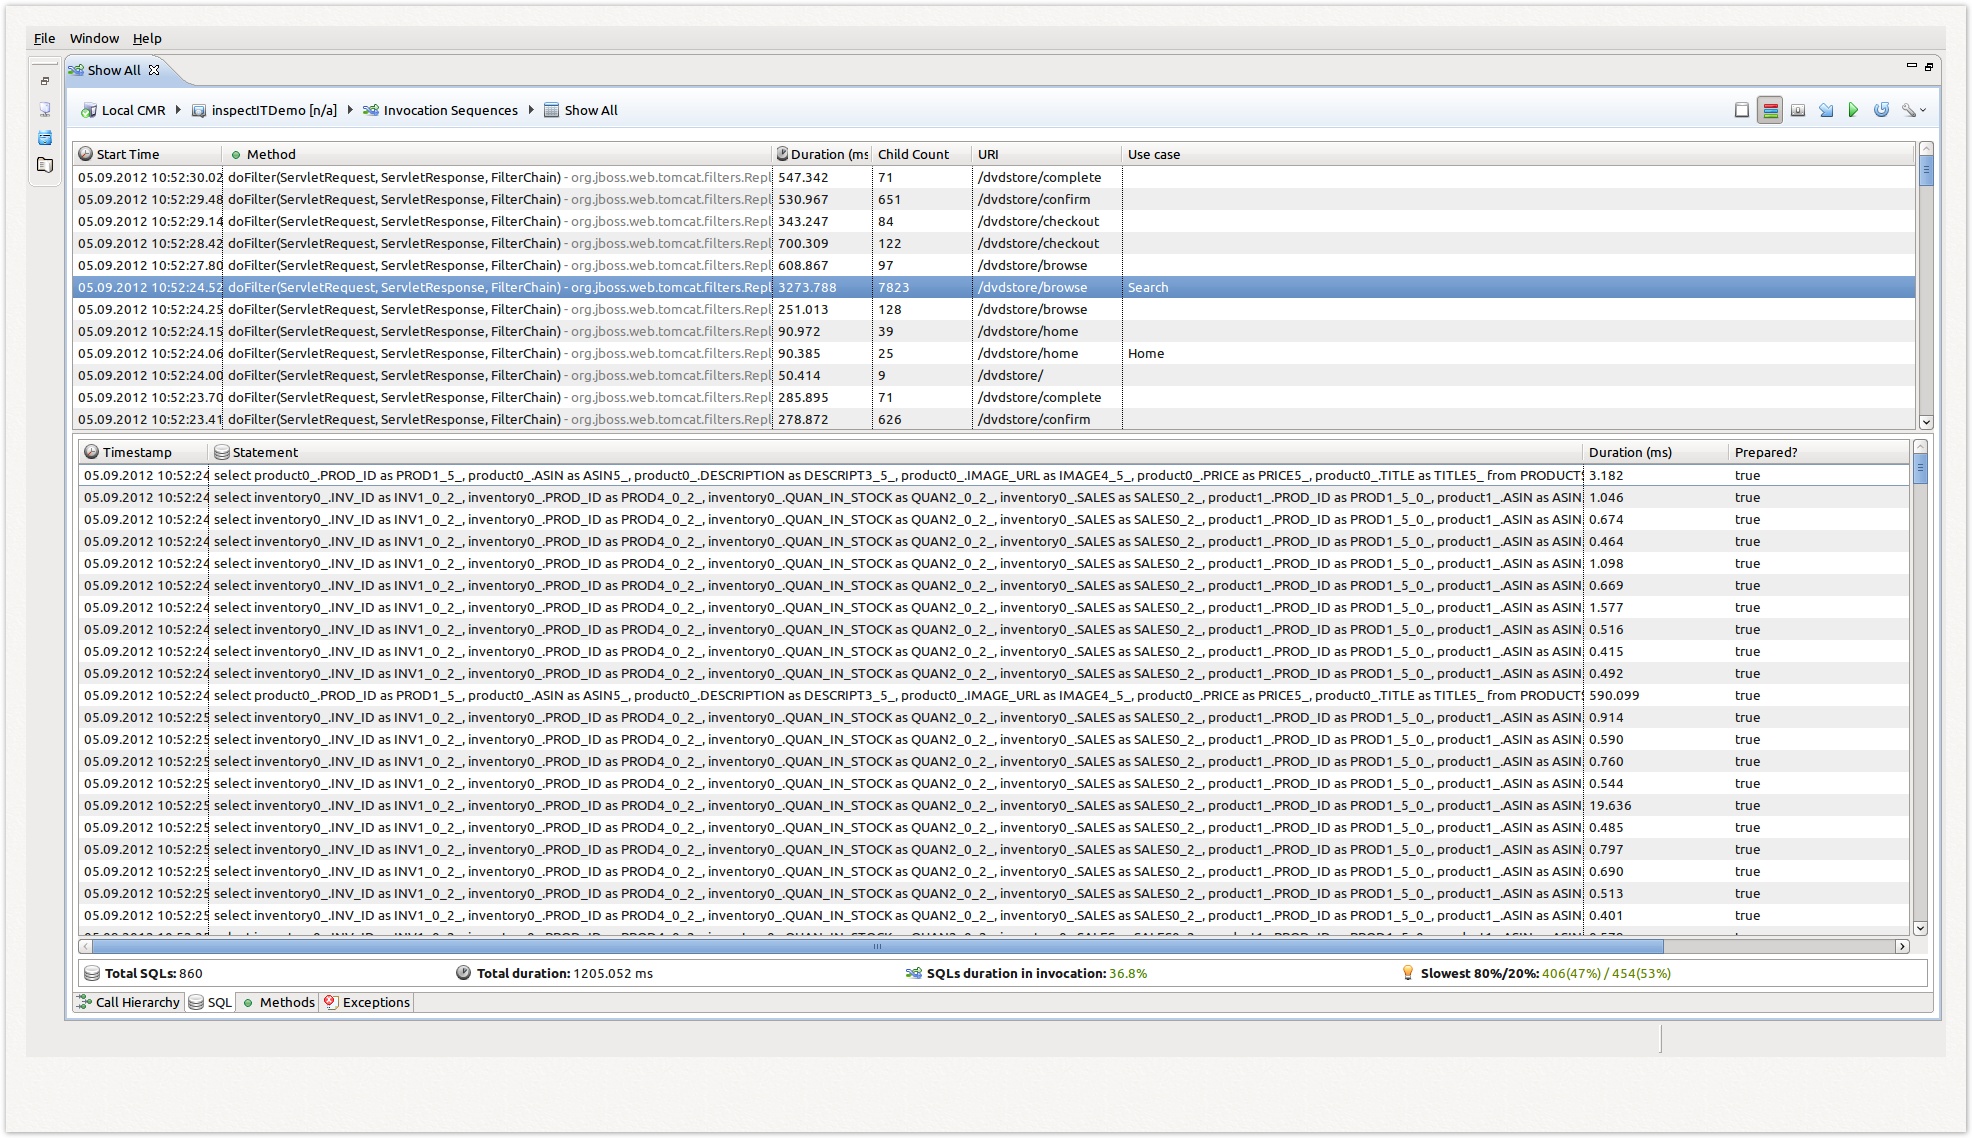
SQL Filter view |
| This view provides a filter on the data collected by the invocation sequence and only shows all SQL statements that were executed. In other words, use this view if you want to visualize all database access that this concrete invocation triggered. It goes without saying that in order to get any information here, database tracing must be enabled. This view provide the additional SQL overview panel with following information:
|
| JDBC/database sensor must be activated | 1.0 | ||||||||||||
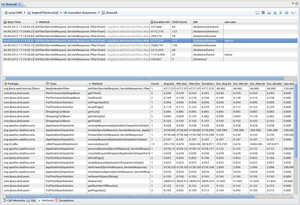
Method view |
| This view provides a listing of all methods that are called within this invocation. This listing aggregates all calls made to the same method and provides minimum, average and maximum information. In addition the total spent is shown. |
| Suitable instrumentation of sub methods with timer sensors | 1.0 | ||||||||||||
Exception view |
| This view provides a listing of all exceptions that were thrown, passed and handled within this invocation sequence. |
| Instrumentation of the exception classes | 1.2 | ||||||||||||
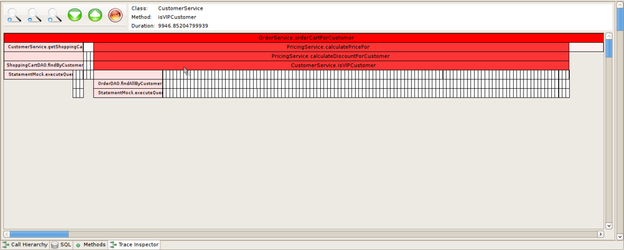
Trace Inspector (not available yet) |
| Provides a visualization of the methods within the invocation as "inverse pyramid". The first level of the pyramid is the entry method of the invocation, the next levels provide the methods being called by the level above. The length of each block relates to the time spent within this method. By looking at the image, one can easily identify which method/s are responsible for performance problems (or - like in the screenshot provided - see that many fast methods are the problem) |
| not released yet | planned |


Using raw/aggregated mode
The SQL Filter view, Method view and Exception view provide the possibility to display data in either aggregated or raw mode. Aggregated mode will aggregate all same data (same method, same SQL statements, same exceptions) found in selected invocation, while raw mode will display all data as they appear in the invocation tree. This can help having the better analysis of the invocation sequence. The modes can be switched by clicking on the  icon in the view toolbar. The difference between two modes is explained on the SQL Filter view example below:
Loading data from a specific time-range
This view enables a user to specify a time-range that the displayed data should be in. By clicking to the  icon the time-range selection opens, where you can select the wanted time-range for displayed data. Note that the entered duration will be relative to the selected until date. Selecting duration of one hour to the current time, will display the data that was collected in the last hour.
