Working with automatic problem diagnosis
Introduction
This feature for inspectIT is launched in the version 1.8 and allows the user to diagnose problems, giving the hint to know which method is taking too much time running.
There are some rules defined in order to diagnose the most typical problems for time wasting. Those rules processed the invocations, diagnosing the problems and offered relevant information.
Currently there are five rules defined, which are connected in the following way:
A quick explanation about how the rules are executed: first of al, the results of rules are stored as Tags. The InvocationSequenceData that should be analyzed by the Diagnosis Engine is stored in the ROOT_TAG, which is not the result of a rule execution, but it is created when the diagnosis engine is triggered. The value of the ROOT_TAG, is injected to the GlobalContextRule. This rule is the first being executed in the pipeline. After it, the GlobalContextRule returns the Global Context as a result, and is stored with is own tag (TAG_GLOBAL_CONTEXT). The TimeWastingOperationsRule requests the previous one (TAG_GLOBAL_CONTEXT). Any rule can generate multiple results of TimeWastingOperationsRule, getting a set of different TimeWastingRules. A rule can also request more than one tag, like the ProblemContextRule. Note that all requested tags have to be on one rule execution path. A rule is executed, when all of its requested tags are available. The remaining rules in the pipeline are executed after the same principle.
Further details for any one of the defined rules can be found in the next links:
- /wiki/spaces/VI/pages/91305234
- /wiki/spaces/VI/pages/91305409
- /wiki/spaces/VI/pages/91305688
- /wiki/spaces/VI/pages/91306058
- /wiki/spaces/VI/pages/91306157
Prerequisites
In order to see diagnosis information the system must have influxDB connected and writing data.
Also Grafana must be set up and running in order to visualize the information.
You can find information about how to setup influx and grafana in these links:
Configuration
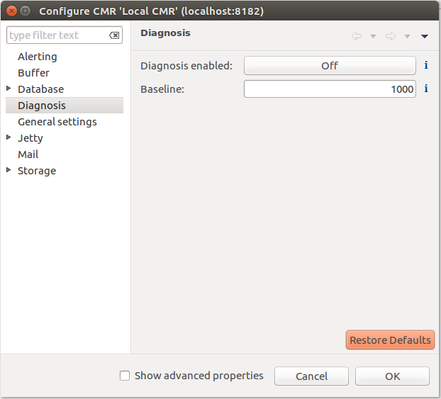
The configuration of diagnose problems can be configured in the repository. You can access to the configuration by right click in the CMR and selecting Diagnosis, by clicking in the Configuration Icon.
By default, automatic diagnose problems will be disabled; it is needed to connect manually the diagnosis feature in the settings menu.
You will see an entry in the menu, under this you will have the enable or disable the function. Also, you can define the baseline this means that all the invocations over this value will be analyzed. The default value for the baseline is 1000 ms.
Data visualization
You can find a dashboard to visualize the information by downloading the json and importing it from here:
https://github.com/inspectit-labs/dashboards
Once the system diagnoses one problem it is written in influx, and with Grafana you can access to the diagnosed data: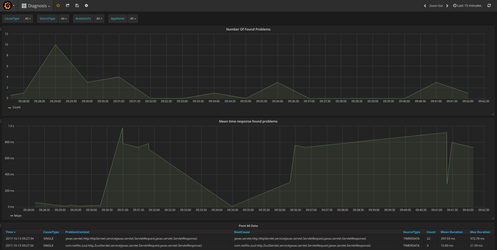
In the dashboard you can find:
- The number of problem occurrences that the system found.
- The mean time for the found problems
- And a table, where you will see:
- The problem context method name
- The root cause method name
- The cause type, which means if the invocation is single, iterative or recursive.
- The source type which can be HTTP, Timer Data or Database.
- The mean time for that invocation in the root method.
You will also visualize the date and time for every invocation.