Working with End User Monitoring
- Ivan Senic
- Jonas Kunz
Introduction
The inspectIT now comes with a new feature: Browser End User Experience Monitoring (EUM). This feature allows you to measure the performance at the browser of the end user, giving more detailed insights than back-end instrumentation alone.
This is done by automatically injecting a JavaScript-Agent into your applications HTML code, which in turn captures relevant metrics at the client-side and sends them Back using AJAX Requests.
When enabled, your back-end traces are correlated automatically with the corresponding browser traces and presented as a single trace in the views.
In addition, for long-term monitoring the end-user request timings are stored in the influx time-series database connected to the CMR and can be viewed using Grafana Dashboards.
Prerequisites
The current implementation of the End User Monitoring only operates on the Java Servlet API, therefore only applications based on this API are supported. The used Servlet Container should not matter, as long as it adheres to the Servlet API standard. Therefore any common Servlet Container (e.g. Apache Tomcat, Glassfish) can be used.
All you need to do is to configure your application to start with the normal inspectIT Java Agent, the EUM-Instrumentation happens fully automatically when configured as described below.
We recommend you to try out the end-user monitoring on your system in a safe environment first before production use.
Configuration
The configuration of the End User Monitoring is available as a new tab in the Environment settings of the CMR, which is shown below:
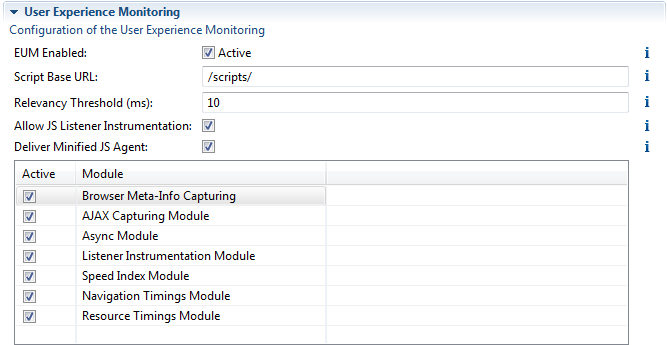
To enable EUM, you first have to tick the corresponding Activate checkbox.
In addition, you have to specify the "Script Base URL": here you should provide a URL prefix, under which the Java Agent will make the JavaScript Agent Script available and to which the JavaScript Agent will send back the results. As this injection works through the Java Servlet API, you have to choose a URL prefix which is mapped to at least one Filter or Servlet. A typical good choice here is the URL under which your static content is available, e.g. "/scripts/" or "/img/".
The "Relevancy Threshold (ms)" allows you to configure how fine-grained your end user instrumentation should be.
The browser agent instruments all entry and exit points for the selected modules (see below), however it filters which monitored executions are sent back to the CMR.
This filtering is done by the relevancy threshold: Any execution taking at least the specified amount of time will be sent back to the CMR and therefore shown in the tracing view.
Note that for some special executions, for example requests, this value is ignored and the trace is always sent to the CMR.
This means, even if you set this value to be very high, you are still guaranteed to see all requests issued by the browser in inspectIT UI.
The configuration also allows you to globally prevent the browser agent from instrumenting any listeners. This is usually not recommended as it greatly reduces the information value of the traces, therefor you should only disable listener instrumentation if you are experiencing performance issues after enabling the EUM feature.
With the "Deliver Minified JS Agent" checkbox you can choose whether you want to use the minified browser agent or the normal source. The minified version should be preferred for performance reasons, the normal version should only be used for debugging.
Finally, you can select from the table which modules of the JavaScript Agent you would like to use, a description of each is given below:
| Module Name | Description |
|---|---|
| Broswer Meta-Info Capturing | Enables the capturing of meta information for each user session. This information includes the used browser, the used device and the language. |
| AJAX Capturing Module | When enabled, all AJAX requests issued by the webpage will be instrumented and monitored. |
| Async Module | Performs an instrumentation to trace the execution of asynchronous operations triggered using the JavaScript Functions setTimeout and setInterval. |
| Listener Instrumentation Module | This module instruments the addListener functions for DOM elements and therefore is able to capture User Actions such as clicks. |
| Speed index Module | Measures the RUM Speedindex, a metric describing how fast the page is rendered. |
| Navigation Timings Module | Captures the metrics provided by the HTML Navigation Timings API. |
| Resource Timings Module | Captures the metrics provided by the HTML Resource Timings API. |
Viewing the Results
When EUM is enabled, your shown in the inspectIT UI will start at the browser now.
The screenshot in this section are some example results after enabling EUM for the Spring Pet Clinic Demo Application with all EUM modules enabled.
In addition to the tracing views, you can view the long-term monitoring data stored in influx using the Grafana Dashboards.
The tracing overview will for example look like the following screenshot:
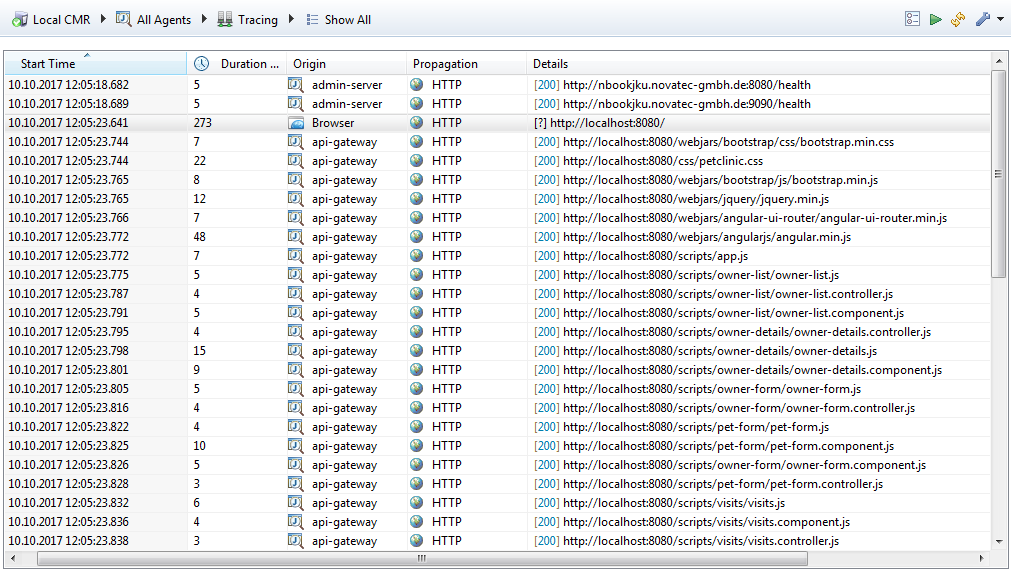
The selected entry corresponds to loading the welcome page in the browser.
The fact that the traces starts at the browser is recognizable through the origin column.
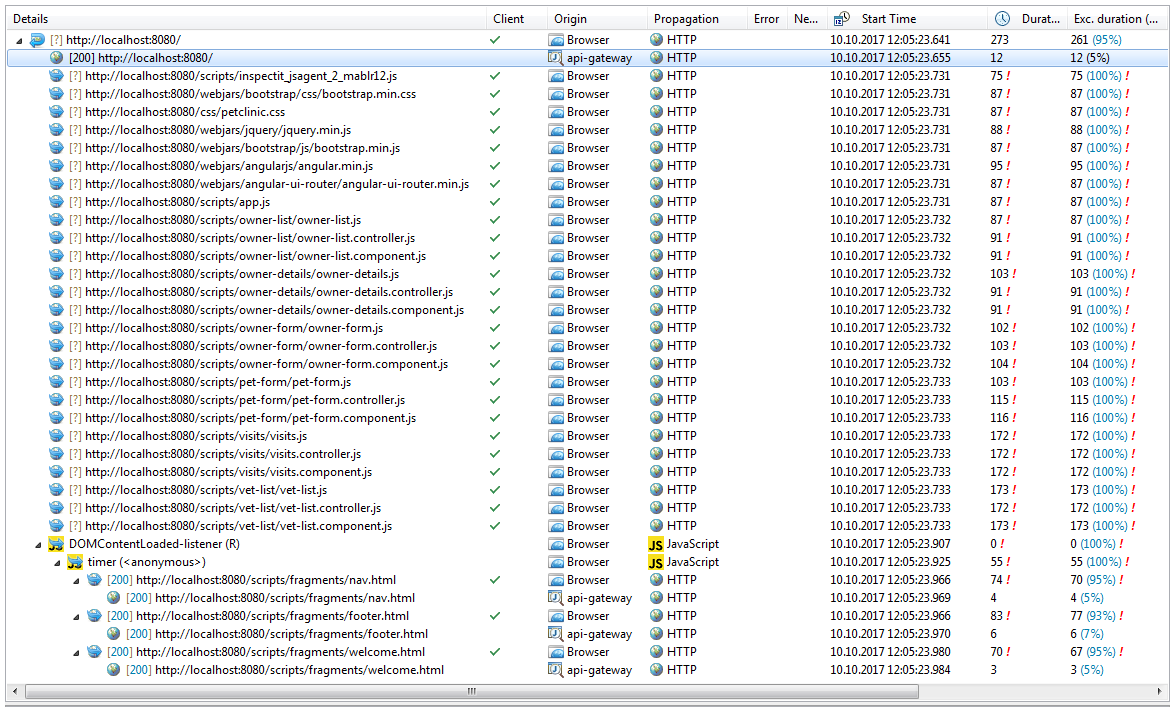
When switching to the trace details view for the selected trace, we can see a trace of several resource loads alongside with some JavaScript invocations triggering AJAX calls:
Troubleshooting
If the EUM does not work even though you configured it as described above, you should look here first as we present the most common problems with their solutions in this section. However, first make sure you have restarted your instrumented Servlet Container, as currently changes to the environment settings are only effective after a restart.
If this section does not solve your problems, feel free to contact us or to fill out a bug report in our JIRA.
Problem: Script does not get injected into the HTML
If everything works properly, the JavaAgent should modify the HTML delivered by your sever injecting tags similar to the one shown below:
<script type="text/javascript">window.inspectIT_settings = {/* some of yourt configuration settings will be here.. */}; </script> <script type="text/javascript" src="/scripts/inspectit_jsagent_1_ablr12.js"></script>
These tags should be the first tags to appear within the head section (or body if you don't have a head section).
Troubleshooting:
- If these tags are not present, first double check that EUM is enabled for your JVM which delivers the responses to the end user.
- A second possible root cause might be compression: The Java Agent has to parse the HTML delivered by your application in order to inject the JavaScript Agent tags.
- If the HTML is passed already compressed to the Servlet API output stream, the Agent is not able to do this, therefore try disabling the compression of the responses.
- If the compression is done "on-the-fly" however, e.g. by using a Servlet API Filter to perform the compression, compression should not affect the EUM injection.
Problem: JavaScript Agent script not reachable
This issue can be detected by opening your webpage with your browsers developer console opened up: The tags shown above are correctly injected, however the browser is unable to fetch the JavaScript Agent source?
The most common reason for this problem is that the configured "Script Base Url" is not a valid prefix, meaning that it is not mapped to any of your filters or servlets. You can test this by manually trying to fetch the JavaScript Agent source. For example, if your server is hosted on "localhost:8080" and you configured the base-url as "/scripts/", try entering "localhost:8080/scritps/inspectit_jsagent_1_1.js" in your browser. If everything works, you should receive the source of the agent, otherwise a HTTP 404 error.
This way you can test different settings for "Script Base Url" to find a prefix which works.