Working with remote traces
- Ivan Senic
Introduction
The inspectIT provides set of Remote sensors that enable to trace and correlate calls made between JVM nodes in your application. Such traces can provide end-to-end view on the user request execution even if it spans over multiple JVMs. The inspectIT provides information on the duration of the remote call, properties like technology used or if call was synchronous or asynchronous. Based on the technology additional information is provided. The configuration for the remote sensors in provided as part of Common profiles and is active by default.
The remote tracing is done in inspectIT as per opentracing.io specification, with similar data model based on spans. In opentracing.io, a trace is a directed acyclic graph (DAG) of "spans": named, timed operations representing a contiguous segment of work in that trace. However, inspectIT does combine the captured spans with the invocation sequences created on each JVM and is able to provide not only the landscape of the JVMs that interacted, but also provide details on the invocation execution during complete trace. This includes all the data that is captured as part of invocation sequences, as SQL statements, exceptions, method calls, etc.
The inspectIT clearly separates the client and server requests processing. Thus, for each request there is a client side span in addition to the server side span. They usually provide same information with possible different timings due to latency or asynchronous type of a call. Also the asynchronous client spans provide only information available at the point of creating the request and are missing information available on the response (like HTTP response code).
The inspectIT does provide the opentracing.io API implementation as part of it's inspectit.agent.java.sdk project, thus users of the opentracng.io API can easily switch to inspectIT as the implementation. Please check dedicated page for more information.
Supported technologies
The inspectIT currently supports tracing of remote communication made by HTTP and JMS. Full list of supported technologies and libraries can be found on the Remote sensors page. The remote sensor provide following out-of-the-box tags based on the technology:
| Technology | Tag | Description |
|---|---|---|
| HTTP | URL | Complete URL of the call. |
| Status | Response code of the call. | |
| Method | Used HTTP method. | |
| JMS | Message ID | ID of the JMS message. |
| Destination | Destination of the JMS message. |
Configuration
As mentioned the configuration for the remote sensors in provided as part of Common profiles and is active by default. However, the inspectIT provides a special Remote Manual Server Sensor. Users can use this sensor to mark additional methods where server spans should be started. This is usually useful for tracing batch jobs, as the users can mark methods where their batch job is starting and thus also get a complete trace of it's execution. Please read Sensor assignments configuration for information on how to apply any sensor to a method.
Working with UI
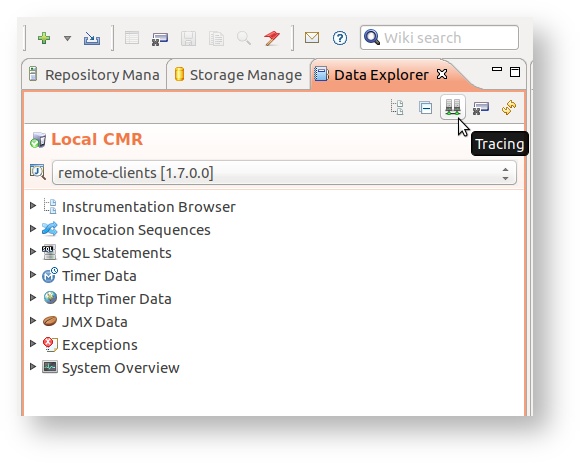
As tracing represents an agent-independent view on the request execution, tracing overview view can be opened from the  Tracing icon, located in the
  Data Explorer View menu.
Tracing overview
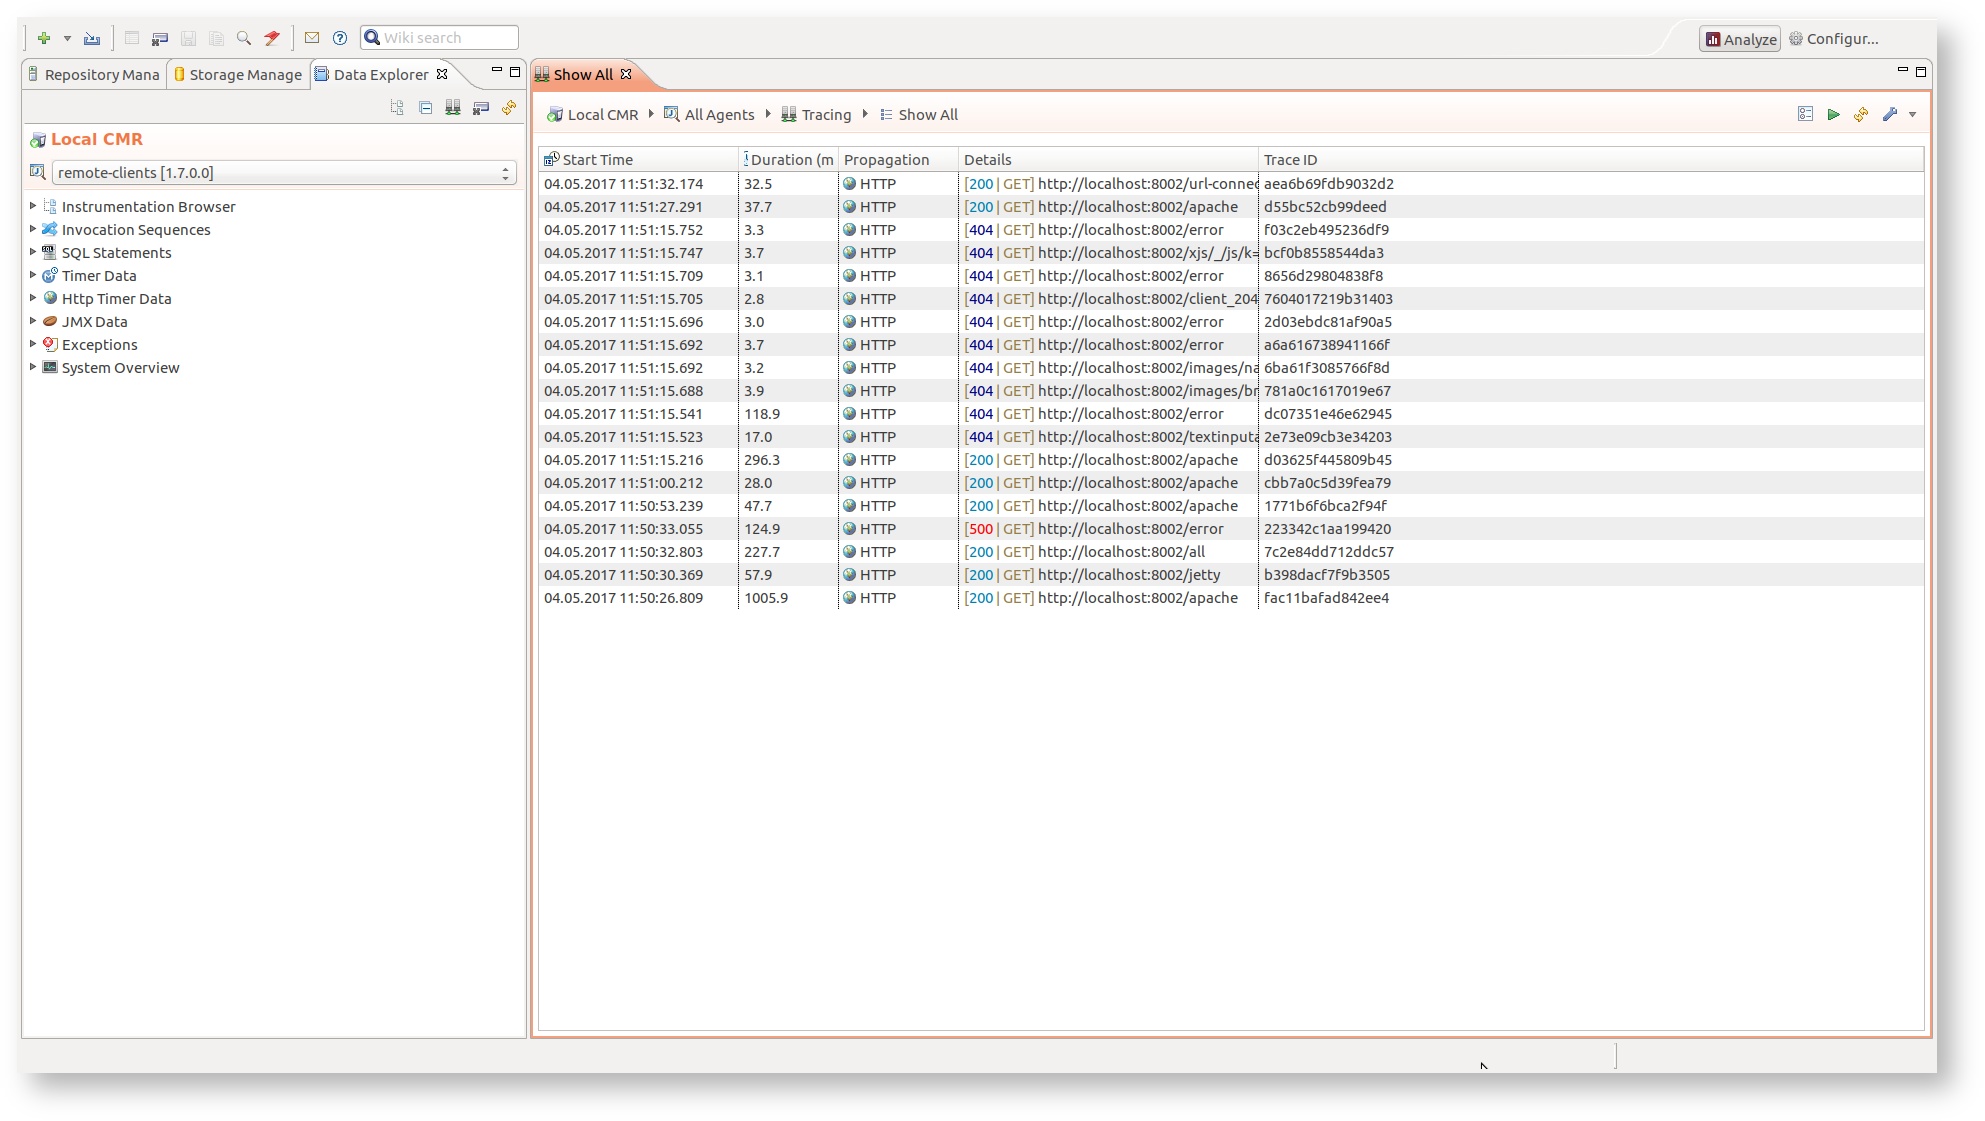
The overview view provides information on all traces independent on the agent they were created. The view provides the table that lists all traces with some basic information about each trace:
- start time
- duration in milliseconds (without any asynchronous child calls)
- description of the entry point
- trace ID
Note that the table actually shows all root spans, which are usually created on the entry points of the user interaction with the system.
Trace details
The view showing details of a trace can be opened by double-clicking in the Tracing overview table or by using the Navigate To → Trace Details option in the context menu.
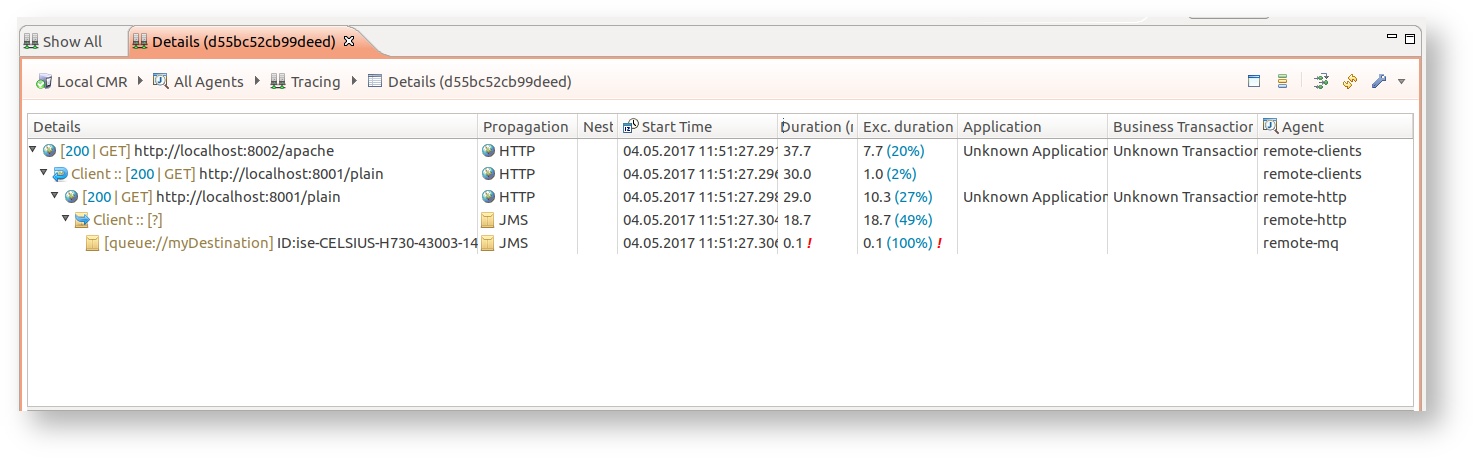
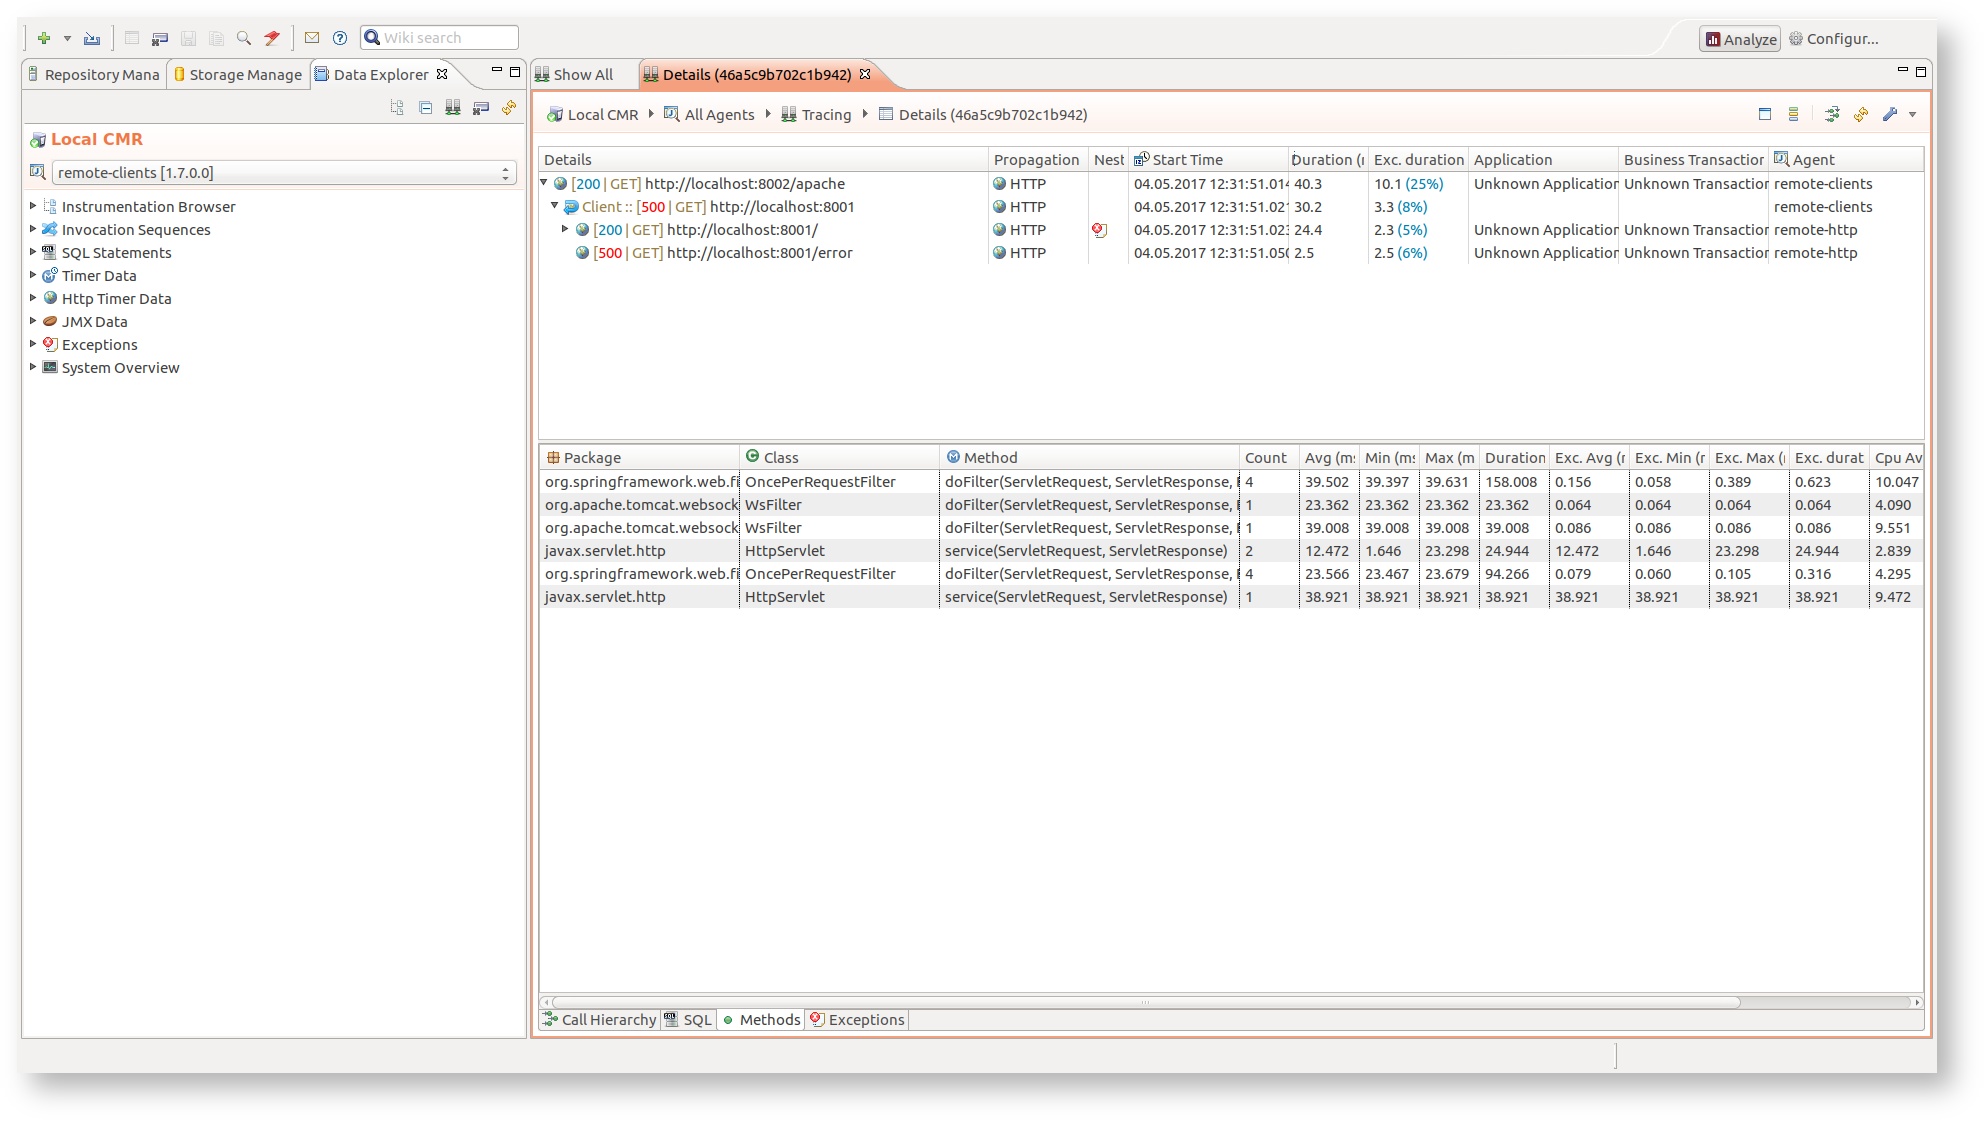
The top part of this view provides an tree representation on trace spanning on the multiple JVMs (agents). Here it's possible to understand duration of each trace part (span) as well as to clearly differentiate client and server spans (request execution). The following tables describes in details each column and data/icon shown:
| Column | Description |
|---|---|
| Details | Provides details on trace part, clearly separates client and server span, plus provides any additional information based on the technology that made span. Client spans provide info if call was synchronous or asynchronous. |
| Propagation | How was span created, usually represents technology of the remote propagation. User created spans are clearly marked here with SDK. |
| Nested Data | Shows if this trace part has nested SQL statements and/or Exceptions, based on the invocation sequence created for that trace part. |
| Start time | Start time of span. Note that this time is agent relative. |
| Duration | Total duration of the trace part. For asynchronous client spans this time is actually only time needed to create/send asynchronous request and not the real time of that request execution. |
| Exclusive duration | Exclusive duration of the trace part. This duration does take info account duration of asynchronous request. |
| Application | Assigned application, based on the invocation sequence created for that trace part (if any). |
| Business transaction | Assigned business transaction, based on the invocation sequence created for that trace part (if any). |
| Agent | Agent where this trace part was executed. |
| Icon | Description |
|---|---|
| Propagation via HTTP communication. |
| Propagation via JMS communication. |
| Denote user spans that were created by inspectIT SDK. |
| Synchronous call. |
| Asynchronous call (or any non-depending/follows from call). |


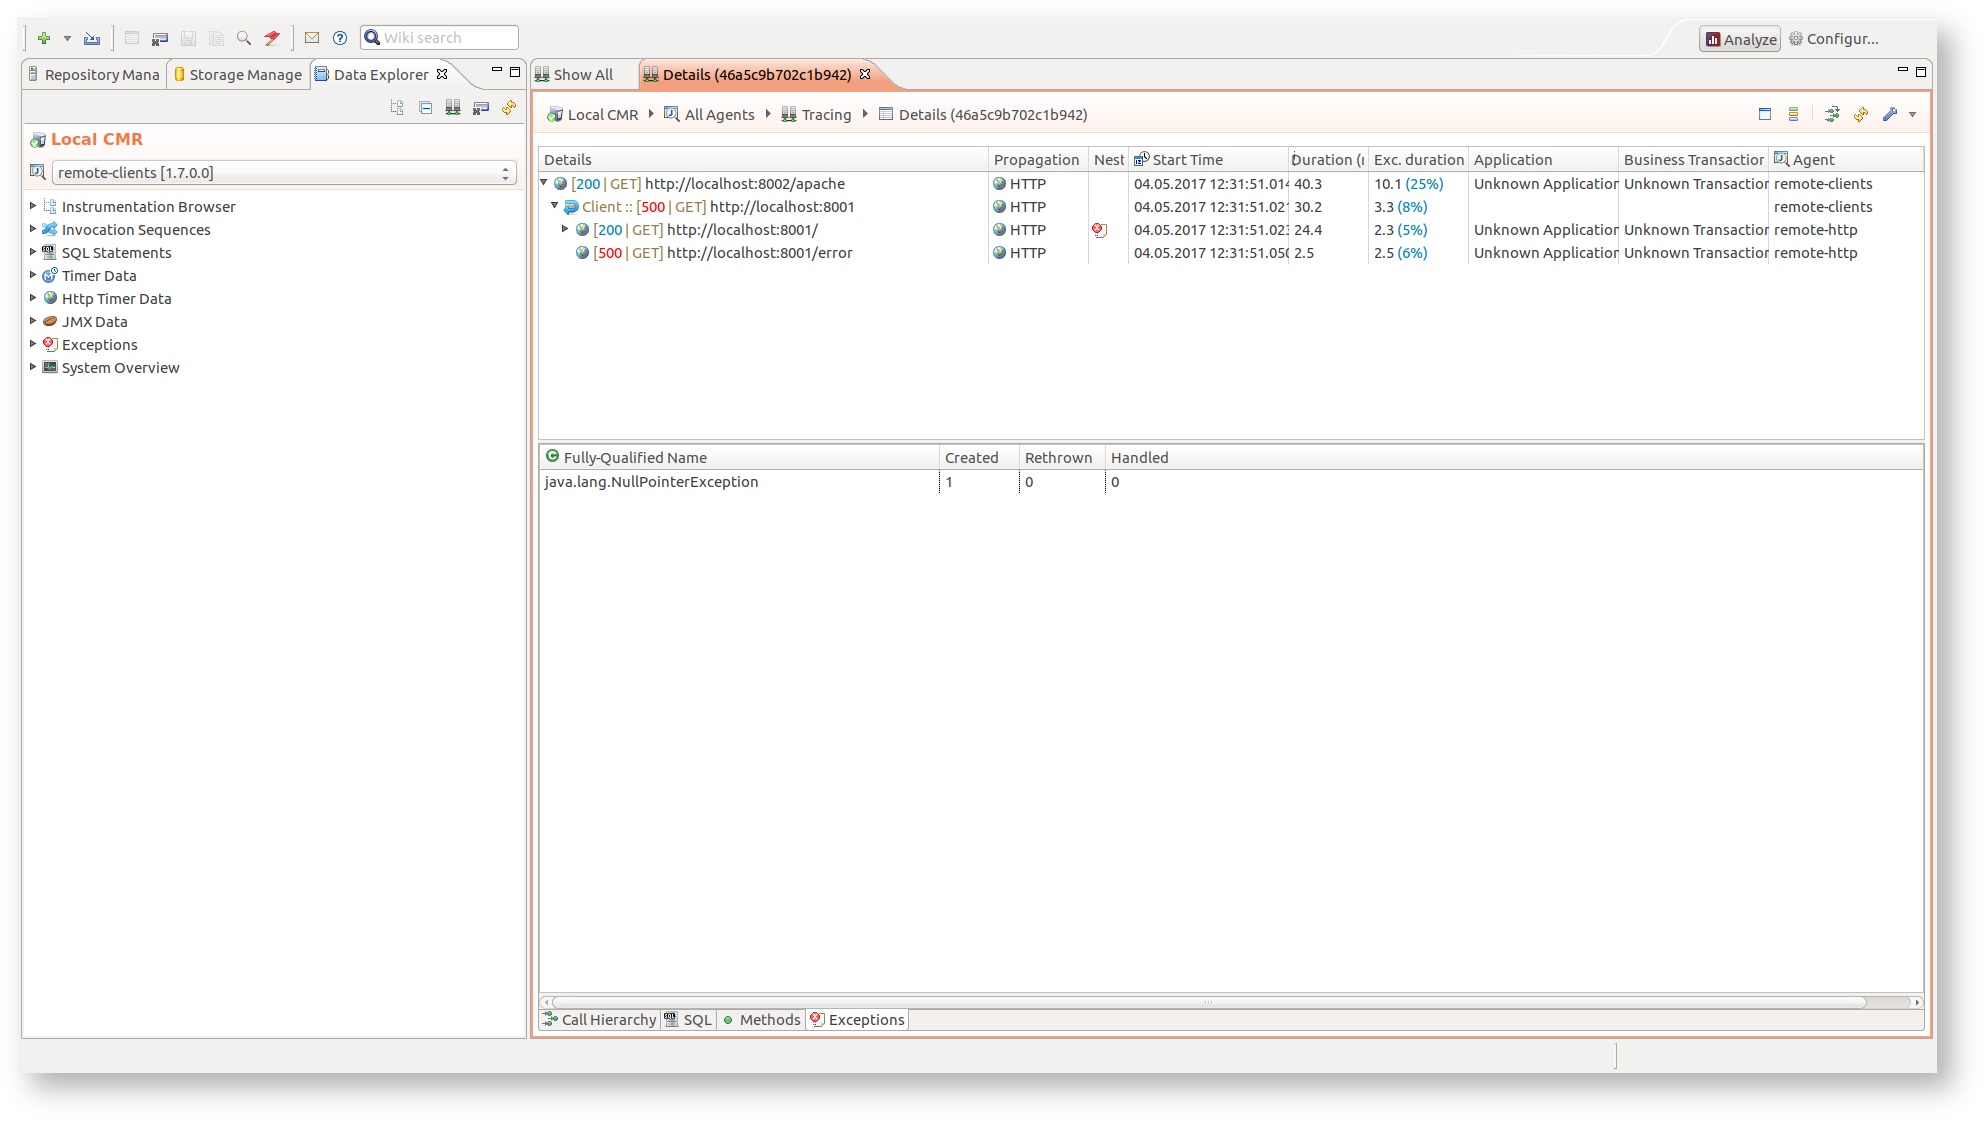
Complete trace call hierarchy
The complete trace call hierarchy is also available in the bottom part of the Trace details view. Here trace information is combined with the invocation sequences created during the trace. This provides more detailed call hierarchy that includes method calls, SQL statements, exceptions etc. In addition the standard invocation sequences sub-views are available as well and they show aggregated method, SQL and exception information during complete trace.
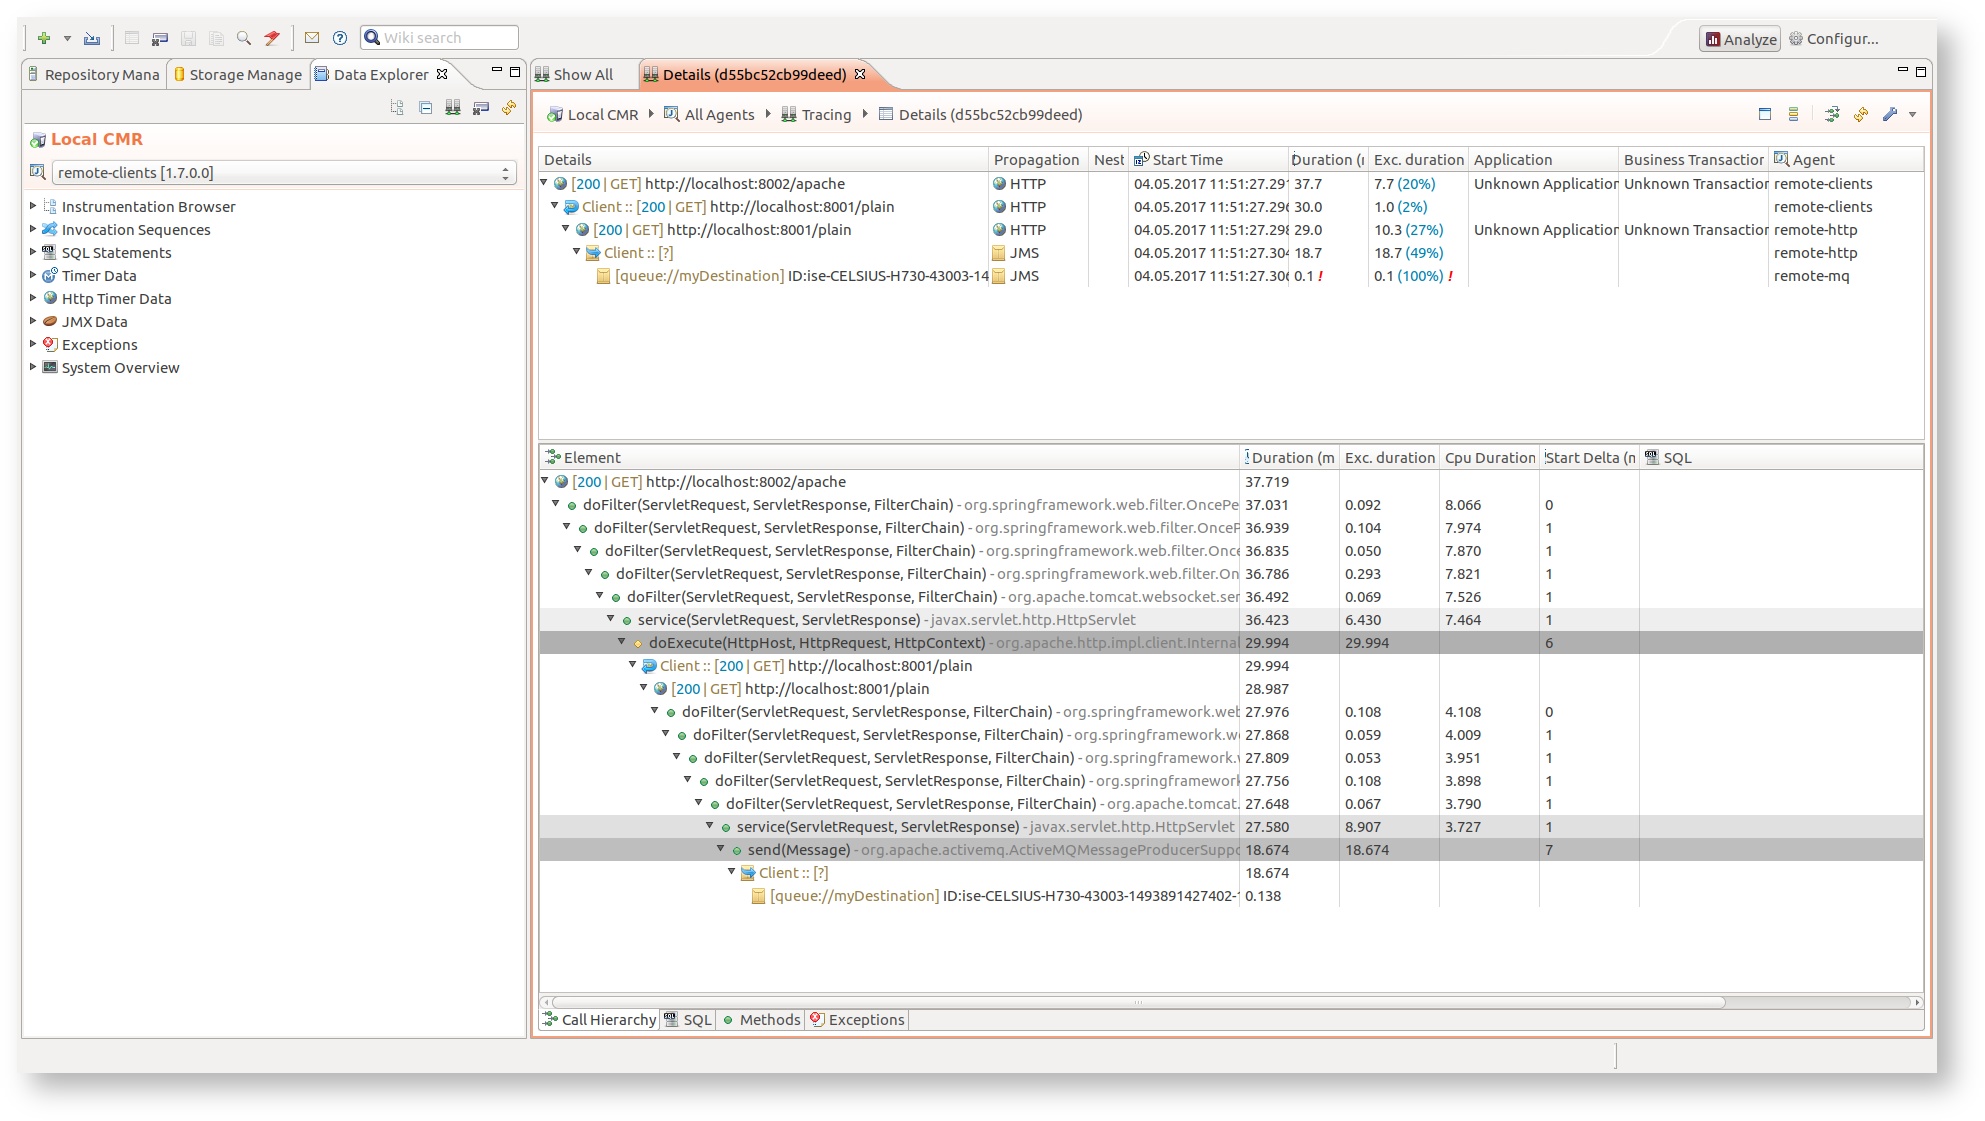
The tracing views support all the standard inspectIT UI features like Search, Sort, Copy, Locate in Hierarchy, Navigate and Details (dialog).
Limitations
Currently known limitations regarding traces are:
- Information about remote calls is not saved in influxDB for long-term monitoring and charting