Exception Sensor
- Copy Space for Confluence
- Ivan Senic
Overview
The Exception Sensor is used to gather information about caused exceptions in an application. The Exception Sensor is able to trace created, thrown, and handled exceptions within a target application. It is possible to gather information about methods and constructors that can cause an exception. You have to specify in the configuration file which classes should be instrumented. There can be as many exception-sensor configurations defined as you like.
From version 1.3 it is possible to instrument Java core exception classes also.
Configuration
Exception Type Definition
from version 1.3
Configuration basics
Using the UI configuration interface no configuration is required at all as method sensor types are activated automatically if a profile defines such sensor assignment.
Simple or enhanced exception sensor
from version 1.3
When in doubt use the simple exception sensor!
- Simple mode will only provide the information where have the exceptions been created. All other informations like passed and handled will not be available. But, there will be no performance overhead for using the exception sensor (overhead is described below)
- Enhanced mode will provide all Exception event types, but will also bring the performance overhead for the monitored application.
Configuration basics
The exception sensor mode setting is available under Sensor options part in the Environment configuration.
String length
from version 1.3
Configuration basics
The string length configuration for all sensors is available in the Environment configuration. You can read more about string length limitations Environment configuration page.
Sensor assigment
Configuration basics
The exception sensor assignment is explained in the Sensor assignments configuration. You can find examples on the Examples page.
The exception sensor is able to use Wildcards (see Agent configuration) for the definition of the class name. The options can be used to define that the provided Exception Class should be treated as interface or super-class (see the super-classes and interfaces chapter in Agent configuration).
Event Types of Exceptions
The JVM traverses different points in the life-cycle of an exception, therefore you will see different event types within the UI. Each event type gives you information about what exactly happened at which point in the JVM.
Event Type | Description | Example |
|---|---|---|
CREATED | Describes the creation of the exception object. | new Exception(); |
PASSED | Describes the implicit passing of the exception object by the JVM (the JVM passes the exception object when it searches for an appropriate handler). This event type also describes the first explicit throw of an exception. |
|
UNREGISTERED-PASSED | Describes the passing of an exception object which was not registered before and has no parent. |
|
RETHROWN | Describes an explicit rethrowing of an exception by reusing the object. | catch(Exception e){ // gets a HANDLED
throw e; // gets a RETHROWN
}
|
HANDLED | Describes the handling of an exception object. An object is always handled by a catch-block (no matter what is really done with the object). | See above example |
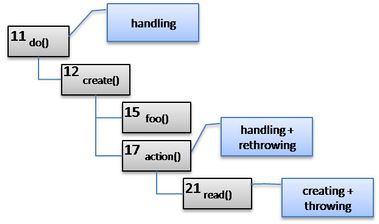
See the below example to get a better understanding of how the event types are assigned to the actions done by the JVM. The number in each method is an ID that represents that method. In this example an exception is created and thrown in the method read(), afterwards handled and explicitly rethrown (by reusing the object) in action(). The JVM traverses the call tree back to the root and passes the method create(), where no exception handler is found, so the exception is going further up. Eventually the exception is handled in method do().
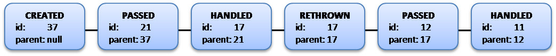
The corresponding event types are shown in the picture below. The ID 37 is not important in this context (it stands only for the constructor that created the exception object).
Performance impact on the target application
For testing the performance impact of the Exception Sensor on the target application an instrumented method hierarchy was created. This can be seen in the picture below. 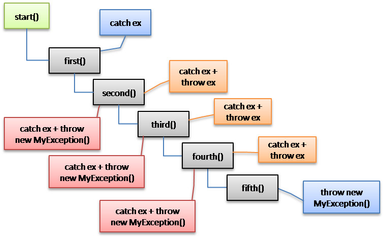
The method start() is the entry point. From here the calls are done of the methods first() to fifth(). The whole method tree is called 1000 times having different sensor type combinations. The methods first() to fourth() contain a try-catch statement. Method fifth() can throw an exception. The different colors represent different testcases. In order to show the impact on other sensor types, the Exception Sensor is tested with different sensor types that work on a method-basis. The following sensor type combinations are tested:
- Timer: only a Timer sensor is defined
- Timer + Exception Sensor: additionally to the Timer the Exception sensor is activated
- Timer + InvocationSequence: The Timer together with the InvocationSequence is defined
- Timer + InvocationSequence + Exception Sensor: additionally the Exception sensor is defined
Testcase 1 - blue-colored
The method hierarchy is called 1000 times without causing any exceptions. This is done in order to test the runtime behavior with an activated Exception Sensor where no exceptions are recorded during runtime. If no exceptions are caused during runtime within the target application, the runtime behavior of the different sensor type combinations must be the same. The result of this testcase can be seen in the below picture.
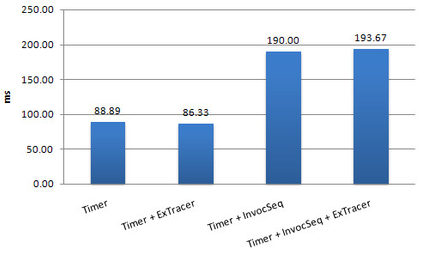
There is no significant difference in the runtimes of the different sensor types. The difference between Timer and Timer + ExSensor is -3%. Also the case having Timer + InvocSeq and Timer + InvocSeq + ExSensor leads to a difference of 2%.
Testcase 2 - orange-colored
The method hierarchy is called 1000 times, where only one exception is created, thrown and then reused. In this testcase an exception is created and thrown in the method fifth(). The methods first() to fourth() all contain a try-catch statement, where the exception object is catched and rethrown by reusing the object. The result can be seen in the following picture.
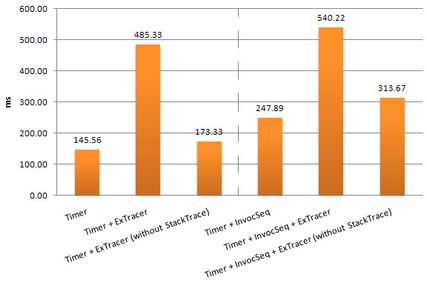
In an exceptional case there is a runtime difference of 233% between Timer and Timer + ExSensor. Also the case having Timer + InvocSeq and Timer + InvocSeq + ExSensor leads to a difference of 117%. This is due to the fact that the stack trace is always saved with the exception object (gathering and saving the stack trace takes some time). The test was repeated with a deactivated stack trace. The outcome is that the deactivation lead to a reduced overhead. Now the difference in the runtime between Timer and Timer + ExSensor is only 19%. Also the difference between Timer + InvocSeq and Timer + InvocSeq + ExSensor is now only 26%.
If the stack trace is not important for analysis, the deactivation of it can improve the performance of the Exception Sensor. Please notice that this functionality is currently not yet implemented.
Testcase 3 - red-colored
The method hierarchy is called 1000 times, where in each method a new exception object is created and thrown. In this testcase an exception is created and thrown in the method fifth(). The methods first() to fourth() all contain a try-catch statement, where the thrown exception object is catched. After that a new exception object is created and thrown. The stack trace is retrieved from each exception object, which of course has an impact on the runtime behavior. The result of this testcase is shown in the below picture.
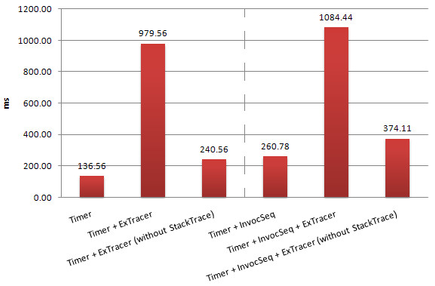
The runtime difference between Timer and Timer + ExSensor amounts to 617%, which is huge. If the stack trace gathering is deactivated, the runtime difference amounts to 76%. Also the combination having Timer + InvocSeq and Timer + InvocSeq + ExSensor leads to a runtime difference of 315%. A deactivation of the stack trace reduces this overhead to 43%.
If the stack trace is not important for analysis, the deactivation of it can improve the performance of the Exception Sensor. Please notice that this functionality is currently not yet implemented.