inspectIT 1.4 Release Notes
- Copy Space for Confluence
20.10.2012 With great pleasure, NovaTecs APM competence group presents the new Version 1.4 of inspectIT. Once again NovaTec demonstrates that application performance management can be done without high initial tooling costs and that free solutions are available.
Sophisticated storage system
Without a doubt the biggest change is the storage functionality. Until inspectIT 1.4 the only possibility to persist detailed information was to store invocation sequences. This was a nice (and quite easy to implement) feature but it also was quite limited in its usability. Stored invocation sequences could only be opened and analyzed but all other analysis means (e.g. navigations from and to different views - like find all invocation sequences where this method was invoked) did not work. With the newly added storage functionality working with persisted information offers exactly the same functionality as working with live data, so each and every navigation that you use on live data can also be performed on stored data. In fact there is no difference in working with live data and stored data.
Create a storage from buffer, set a timeframe to automatically record or just start the recording manually
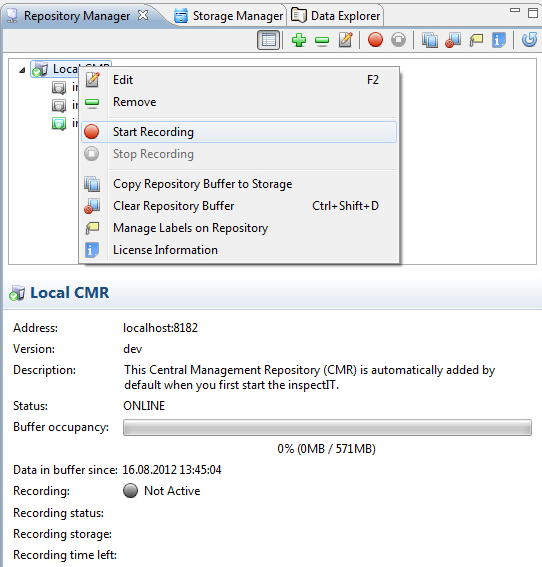
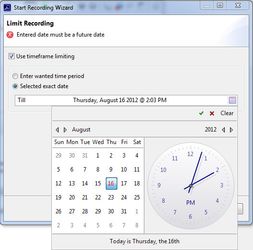
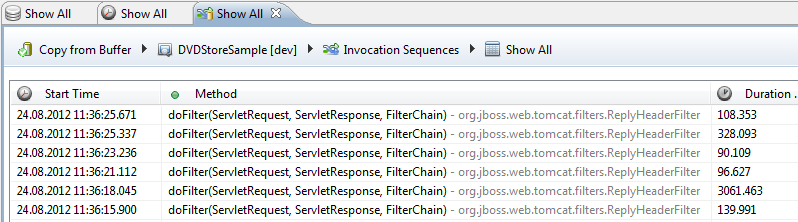
There are many possibilities to create a storage. You could simply tell inspectIT to start the recording at a specific time and to stop it after a certain time. This feature is tremendously useful if you execute loadtests during the night and want to ensure that all data of this loadtest is executed. For sure you can also easily just tell inspectIT to start recording right now and manually stop it. Often we encountered the situation in which we saw interesting information in the in-memory buffer and just want the whole buffer to be stored. With inspectIT 1.3 you basically need to select all invocation sequences (and wait for 30 minutes), with inspectIT 1.4 you simply tell inspectIT to store the whole buffer and you are done.
|
|
|
|
|
|
|
Share your storaged data, Move them locally to improve performance
Storages are by default created on the server (CMR) and can be viewed by anyone. This allows a team of developers/architect to analyze data together on the fly. In addition you could also download the storage locally to your computer to improve performance or to take it to the sbahn/airport/home to analyze later.
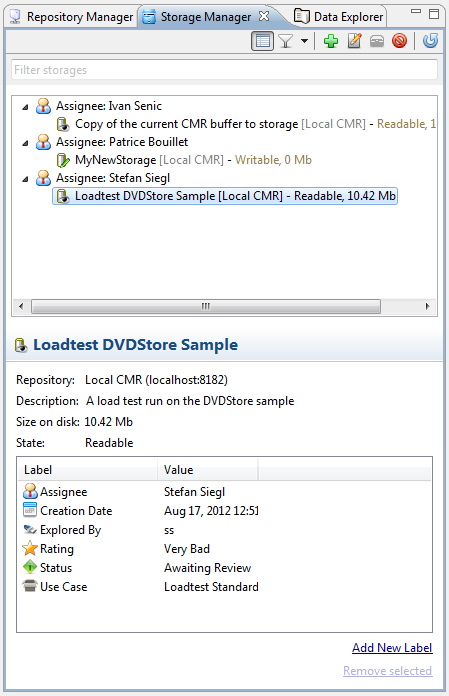
Organize your storages using labels
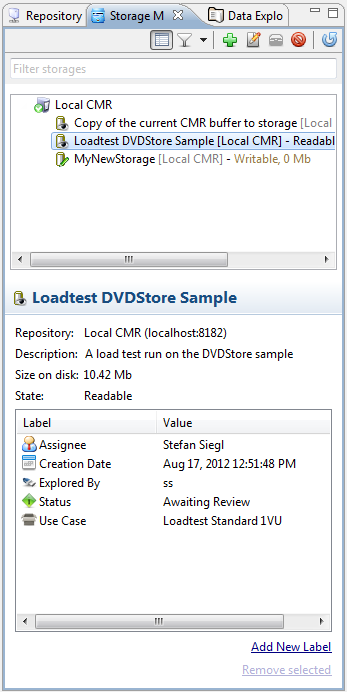
APM tools often provide storages of one or another kind. What we disliked about most of them is that it is basically impossible after using them for some time to find the storage you are interested in. This is mostly due to having no system to describe storages in a meaningful way. Often only a string is provided. inspectIT provides a very sophisticated labelling system that you can use to describe your storages. Each storage by default gets a few labels like the creation date, the size, the status, etc. assigned to it. You can also create your own label to descibe your storages in more details and - most importantly - order the storages by these labels. During testing at one customers site we defined as labels like "application version", "importance" and "status" (open/analyzed/closed) to easily label our storages.
The storage view provides filtering and grouping views based on all these labels. You could for example simply sort the storages by assignee. Or you could group based on an application version, or the date, or any other label. This gives you a very powerful functionality to easily find the information you are looking for. Keep in mind that you can create your own labels as you see them fit.
|
|
|
|
|
Improved analysis possibilities
Capturing of return values
The context capturing of inspectIT is extended by the means to capture the return value of a method invocation. Return value capturing also provides the functionality to traverse the fields of the returned objects to get the information you really need. Read on for further information
Raw and aggregated views
inspectIT now provides raw and aggregated views for all tabs within an invocation sequence. For example opening the SQL details on an invocation sequence you can select to see all SQL queries that were executed within this invocation sequence (raw mode) or select the aggregate mode to aggregate based on the SQL query and see aggregated timing information.
Navigational possibilities
The navigation functionality allows an analyst to quickly follow a performance problem to its root (top to bottom) or to check if a performance problem is only affecting one part of the application or the application in its whole (buttom to top). inspectIT 1.3 already provided simple navigational possibilities that allowed basic "top to bottom" analysis. You could start for example in the HTTP view, select all requests for one URL and hit "navigate to invocation sequences". This provides you with all invocation sequences that contain http requests for the selected URL.
With inspectIT 1.4 a lot of new navigational options were added. For a more detailed view have a look at Working with navigation and stepping functionality
Invocation sequences can now be filtered by timeframe
The invocation sequence view allows to filter based on a timeframe and will only display these invocation sequences.
Search functionality
With inspectIT 1.4 each view now enables you to simply find the information you are looking for in a view. Simply enter the name of the method you are looking for an inspectIT points you to the node in the invocation sequence. You can also easily jump to the next occurrence of the string and thus easily traverse the whole invocation sequence.
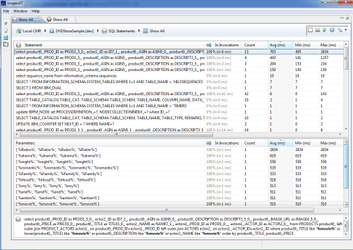
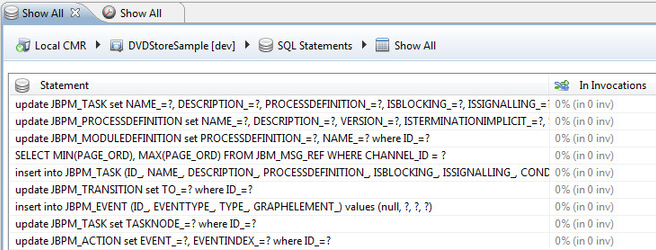
Improved SQL view
The new database view in inspectIT now allows to aggregate based on the combination of bind variables. So you get a basic aggregation of metric data per SQL and one aggregation per distinct bind value combination within this query. This information helps a lot as often a query is only slow if certain parameters are passed to it. Using the new SQL analysis view you can easily drilldown from the aggregation of a generic SQL to the concrete aggregations for a specific set of parameters. In addition you can also easily copy the SQL including the parameters and execute the statement yourself or give it to your DBA for closer examination.
In the attached screenshot you can see that the selected query had an average runtime of 703 ms, but for certain combinations of bind variables the average was more than 2,5 seconds.
|
|
|
Summary SQL information for invocation sequences
Invocation sequence SQL view now provides a summary line that shows how many SQLs are executed, their overall duration and their contribution to the overall invocation sequence duration.
The new 80/15/5 system shows the distribution of the duration over all SQL queries. This information shows how many queries make up 80%/+15%/+5% of the complete SQL execution time. So if you are having 1000 SQL queries and this information states 1/2/997 you know that 1 query makes up 80% of the duration of all SQL queries and 3 queries make up 95% of the execution time. So you basically have a situation in which you can improve the performance heavily by improving these 3 queries.
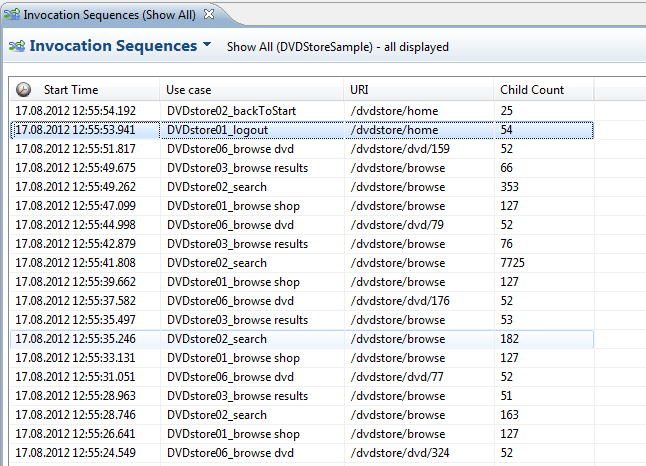
Improved HTTP details for invocation sequences
The invocation sequence view now shows the URI and the Use Case as additional columns.
User interface improvements
Restructuring
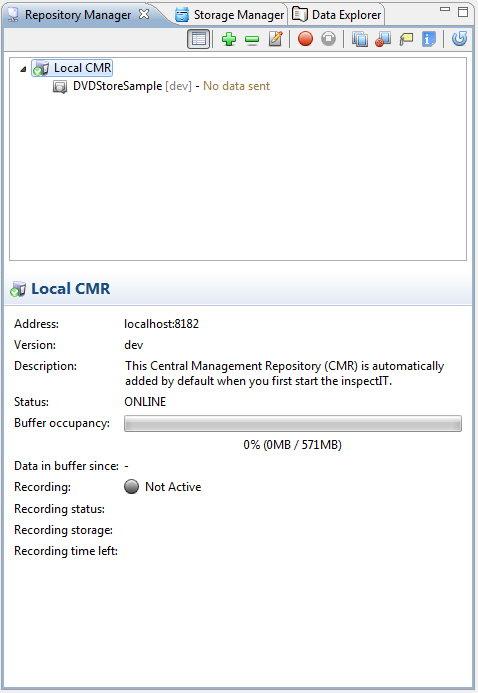
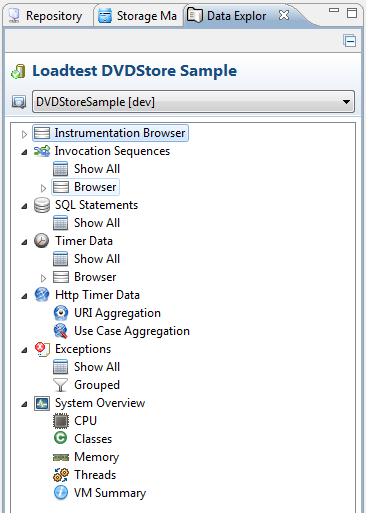
The user interface is now cleanly separated into a three views:
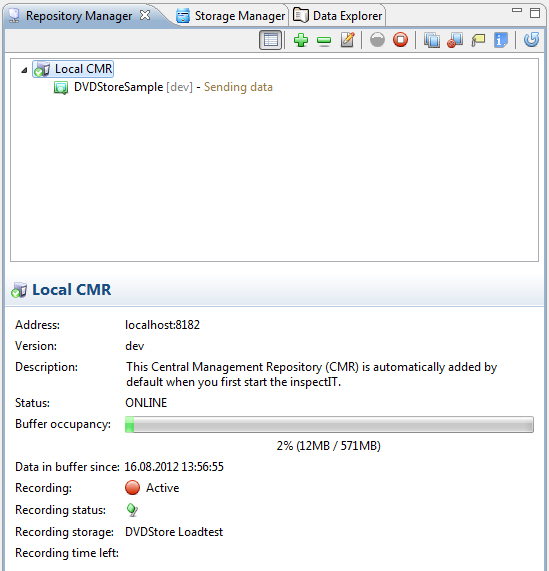
- The repository view shows all connected CMRs and information about the status of the server. It now also provides information about the size of the in-memory buffer, the recording state and the date of the oldest invocation sequence still in the buffer.
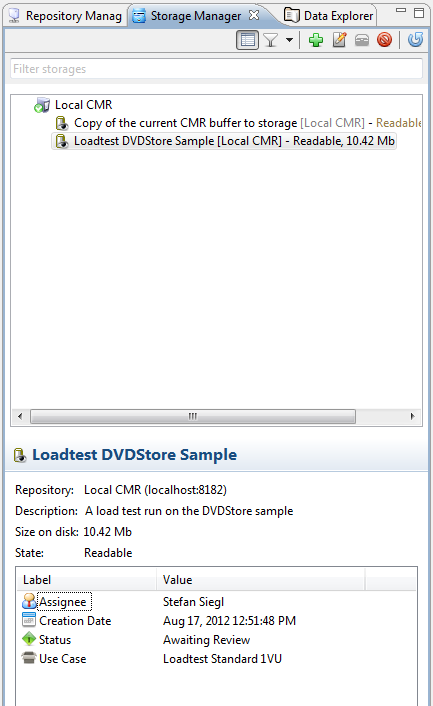
- The storage view shows all storages that are created. This view allows to easily filter/sort by the labelling system and open a storage for analysis
- The analysis view allows to analyse the data from a repository (live data) or the storage (stored data). This view is opened by double-clicking a storage or a repository.
|
|
|
|
|
|
|
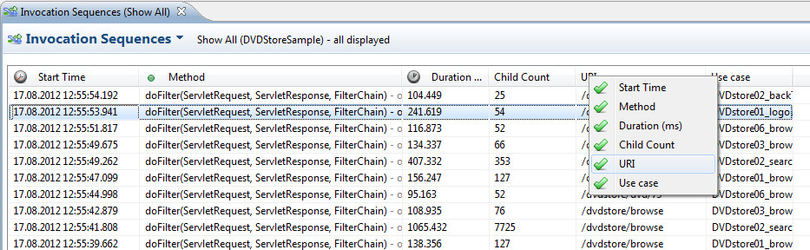
Reordering and selection of columns
Each table-based visualiation now has the option to re-arrange the order of columns and to select which columns are meaningful to you and hide the rest. It goes without saying that this configuration is saved for you in your client settings. So different users can have different column layouts as they like.
|
|
|
|
|
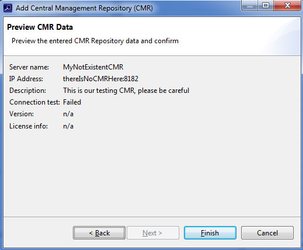
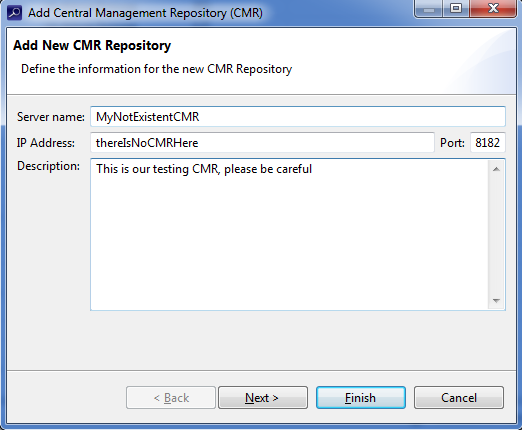
Intuive creating of new CMR and storages
Creating and updating elements (like creating a new CMR) is now more intuitive as the inspectIT user interface is changed to make heavily use of wizards that guide the user. These wizards automatically check if the given information is correct e.g. checking if the entered CMR is really available.
|
|
|
|
|
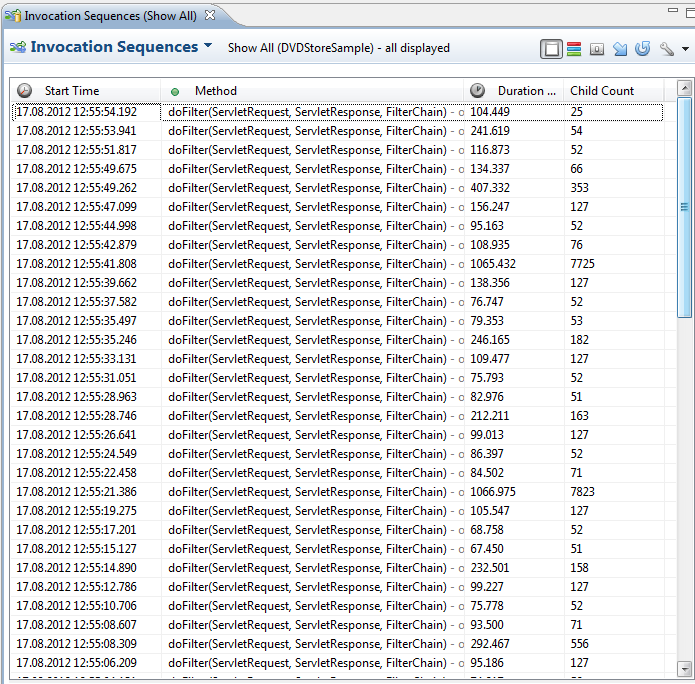
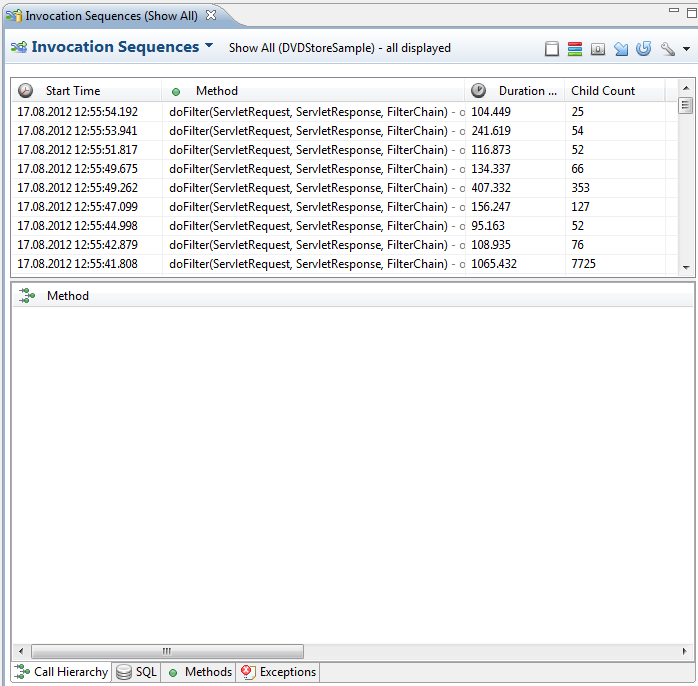
Maximize (sub-) views
You propably know how cumbersome it was to analyse invocation sequences as you always had to adjust the size of the lower hand display to see more of the invocation sequence details. inspectIT 1.4 now comes with the functionality to maximize subviews. That is you can tell inspectIT to use the whole screen to display the detailed invocation sequence. It goes without saying that this feature is not only available for invocation sequences but for all views.
|
|
|
|
|
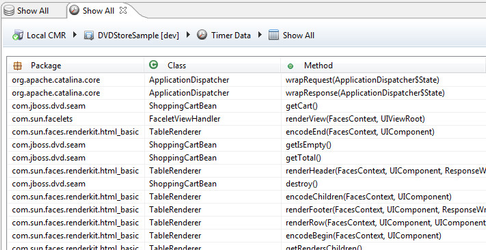
Breadcrumbs view
Each view in inspectIT now provides so-called breadcrumbs, which allow you to easily see what data you are currently displaying. The breadcrumb shows if the data is coming from a storage or a live session on a certain CMR, which agent is used and which view is currently opened.
|
|
|
|
|
|
|
Misc...
IBM JVM support: Read system information
System information can now also be read using the IBM JVM. Prior to inspectIT 1.4 system information could only be read with Sun Hotspot JVM and trying to read them on IBM JVM resulted in an error.
Agent registration without using the IP for differentiation
Sometimes the combination of agent name + IP addresses to register an agent lead to situations in which after restart of the application always a new agent is registered (instead of the old agent reused). inspectIT 1.4 now allows to identify the agent by its name alone.
Improved CMR output regarding agent registration
The CMR output now gives additional information about each agent that connects. This information contains the agent version, the agent name and the agents IP adresses.