Sensor Profile
Sensor Profiles are environment specific definitions of sensors. The agent will base its next conduct of instrumentation of the application on these definitions.
Inside a profile one can define Method Sensors and Platform Sensors. Also it's possible to link profiles, that is to reuse the sensor definitions of another profile without readding the Sensor Definitions to the current profile. Only profiles inside the same environment can be linked together.
There is also a General section, where the user can handle the name and a description of the current profile.
Method Sensors
Please note:
The detailed process of defining a method sensor can be found here.
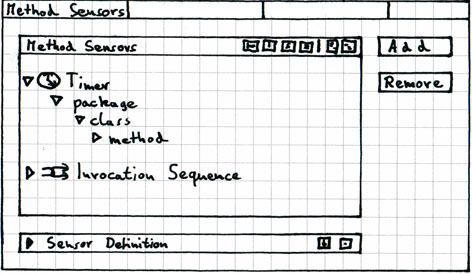
This Section is divided into two parts. The upper part shows all defined method sensors. The lower part is used to configure the method sensors and can also be folded-out. In a collapsed state the upper part takes up the available space.
Upper Part (Method Sensors)
The top part shows the sensor definitions in a tree structure. The user can switch between two formations via the buttons left aside the Add-Button. The tree order is either package - class - method - sensor or sensor - package - class - method. The following listing shows the button and the corresponding tree structure:
In a productive environment the amount of sensor definitions will outrun the available visualization area. This can be a bigger problem as it seems at first look, and it cannot be resolved with just a scrollable container. At this point the usage of filters comes in very handy. The following filters are intended:
show only definitions including wildcards
show only definitions with the setting "interface=true"
show only definitions with the setting "superclass=true"
show only definitions with the sensor "Timer"
show only definitions with the sensor "Average Timer"
show only definitions with the sensor "Invocation Sequence"
Activation and deactivation of sensor definitions
If sensor definitions are not needed in a following monitoring of an application they can be deactivated. This means that deactivated sensor definitions are not considered during the instrumentation process. Later on a deactivated sensor definition can easily be added without defining a new sensor definition.
Activation and deactivation can either be done via the context menu of the sensor definition or a button residing in the bar which also contains the buttons for grouping and filtering purposes.
Bottom Part (Sensor Definition)
Please note:
The definition of a sensor can be a rather complex process. Please follow this link to get detailed information about the single steps for defining a (method) sensor.
Platform Sensors
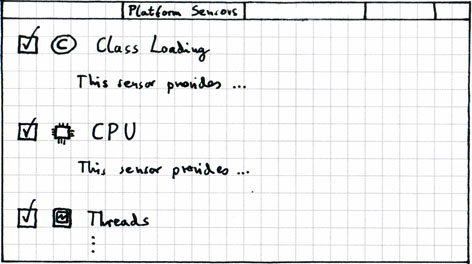
Platform Sensors don't need any special configuration. It is as simple as turning them on or off for the monitoring of an application. Adding a Platform Sensor can easily be done by checking the check box of the Platform Sensor. Every Platform Sensor has a short description.
Exception Sensors
NOTICE: In the pages images the exception sensor isn't included.
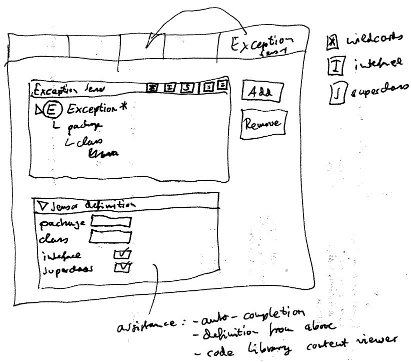
The flexible tab architecture allows us to integrate the exception sensor easily. The following draft shows the tab for the exception sensor. The tab will be add between the other sensors and the tab for the linking of profiles. The layout and functionality is nearly the same as for defining method sensors.
Linked Profiles
Within a Profile it's possible to include other Profiles. So if a profile A includes a profile B then all of profile B's sensor definitions will be available in profile A. This can be used to tie different sensor packages together, e.g. different types of sensors or sensors for different parts of the application.
Top Part (Included profiles)
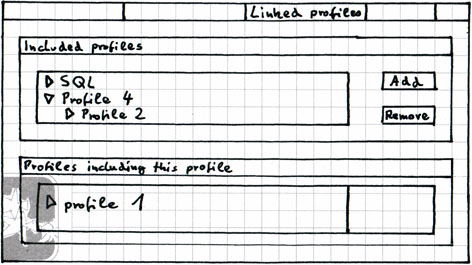
The top parts shows the Profiles included by the current Profile. The tree structure helps to see the possible hierarchy of included Profiles. The current Profile includes Profile 4, which itself includes Profile 2.
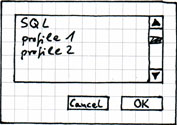
Profiles can be add and removed via the buttons on the right side. For adding a profile the dialog shown in the following image will be used. The list contains the other Profiles of the environment and predefined Profiles like e.g. database specific Profiles.
Bottom Part (Profiles including this profile)
This is a simple list showing all Profiles in the same environment that include the current Profile.
General
This section includes the name and a description of the profile.

