Garbage Collection in inspectIT
- tk (Unlicensed)
- ssiegl (Unlicensed)
- ise (Unlicensed)
At the moment inspectIT CMR uses CMS (Concurrent Mark Sweep) garbage collector. This collector was tuned by the inspectIT team to perform as best as possible. When tuned, the settings were aligned toward the buffer CMR has and a fact that we expect high amount of long living data. However, the tuned garbage collection was never deeply tested and there was no confirmation about it's performance. Because of this, there was need to perform heavy testing of the current collector.
In addition there was an intention to compare the current collector with the G1 garbage collector, that is available in Java 7 (also available in Java 6, but should be improved in newer versions of JVMs).
Test Setup
Two machines where used for the testing:
- QuadCore, 16GB RAM, 160GB disc
- QuadCore, 8GB RAM, 160GB disc
On the first machine the inspectIT CMR, occupying the total of 8GB heap space.
The second machine was used to generate load. Since we wanted to have quite a high load we could not use the DVD Store, since monitoring of it does not produce too much data and buffer on the CMR gets full very slow. Instead we used the Invoker application. For each test we started the three Invoker processes, each generating load with 10 threads.
CMS
The inspectIT CMR currently has following JVM settings (adapted for 8GB heap size):
-Xms8192m -Xmx8192m -Xmn2048M -XX:MaxPermSize=192m -XX:PermSize=128m -XX:+UseConcMarkSweepGC -XX:CMSInitiatingOccupancyFraction=80 -XX:+UseCMSInitiatingOccupancyOnly -XX:+UseParNewGC -XX:+CMSParallelRemarkEnabled -XX:+DisableExplicitGC -XX:SurvivorRatio=5 -XX:TargetSurvivorRatio=90 -XX:+AggressiveOpts -XX:+UseFastAccessorMethods -XX:+UseBiasedLocking -XX:+UseCompressedOops -XX:+HeapDumpOnOutOfMemoryError -server -verbose:gc -XX:+PrintGCTimeStamps -XX:+PrintGCDetails -XX:+PrintTenuringDistribution -Xloggc:logs/gc.log
From above we can see that there is total of 8GB of heap space, where 6GB belong to old generation, while 2GB are reserved to new generation. In the new generation the ration between eden and survivor space is 1:5.
The interesting and very important options are -XX:CMSInitiatingOccupancyFraction=80 -XX:+UseCMSInitiatingOccupancyOnly. They basically define that the concurrent collection should only start when the occupancy of the old generation is above 80%. Since the buffer in the CMR is by default sized from 55%-65% of the old generation, we wanted to make sure that once the concurrent collection start there will be a significant amount of data that is being able for garbage collection.
The test with the described settings showed following results:
| Throughput | Freed MB/Min | Avg Pause | Max Pause | Full GC |
|---|---|---|---|---|
| ~93% | 1601 | 1.12s | 2.06 s | nein |
We were quite surprised with the results, they seamed to be very good.
G1
The first task with using the G1 was to find the best configuration. We tested many different ones, starting from complete default to changing parameter by parameter. The default configuration showed worst results and with the improvement brought by our second configuration we were sure that more tuning will bring G1 performance close to the CMS. However, we were not able to do so. The throughput was constantly way under 90%. In addition we noticed that all tuning that we do bring very little change in the results and from that we concluded that is quite hard to change the behavior of G1 collector.
The table below summarize the settings and results of G1 collector:
| Region Size | Reserve Percent | Heap Occupancy Percent | Max GC Pause | Pause Interval | New Ratio | Survivor Ratio | Threshold | GC Threads | Throughput | Freed MB/Min | Avg Pause | Max Pause | Full GC |
|---|---|---|---|---|---|---|---|---|---|---|---|---|---|
| Default | Default | Default | Default | Default | Default | Default | Default | Default | 64.26 | 1911 | 5.67 s | 29.5 s | ja |
| 16 MB | 20 | Default | Default | Default | Default | Default | Default | Default | 86.32 | 2334 | 0.77 s | 2.61 s | nein |
| Default | 25 | Default | 2 s | Default | Default | Default | Default | Default | 88.07 | 2367 | 0.7 s | 4.13 s | nein |
| 32 MB | 20 | Default | Default | Default | Default | Default | Default | Default | 84.83 | 2501 | 0.87 s | 19.42 s | ja |
| 32 MB | 20 | Default | 1 s | Default | Default | Default | Default | Default | 86.76 | 2356 | 0.8 s | 4.02 s | nein |
| 8 MB | 20 | 0 | 1 s | Default | Default | Default | Default | Default | 86.59 | 2228 | 0.51 s | 3.74 s | nein |
| 8 MB | 20 | Default | 1 s | Default | Default | Default | Default | Default | 88.23 | 2334 | 0.76 s | 3.86 s | nein |
| 4 MB | 20 | 75 | 1 s | 3 s | Default | Default | Default | 4 | 76.93 | 2023 | 5.14 s | 24.91 | ja |
| 4 MB | 20 | 4 | 1 s | 3 s | Default | Default | Default | 4 | 85.14 | 2078 | 0.55 s | 3.16 s | nein |
| Default | 15 | Default | 2 s | Default | 1 | Default | Default | Default | 76.41 | 2146 | 2.12 s | 32.65 | ja |
| Default | 15 | Default | 2 s | Default | 3 | 5 | 5 | Default | 88.02 | 2344 | 0.84 s | 3.25 s | nein |
| Default | 15 | Default | 2 s | Default | 3 | 5 | Default | Default | 87.53 | 2396 | 0.71 | 5.14 | nein |
We concluded that the following G1 configuration seamed to be the best:
-Xms8192m -Xmx8192m -XX:MaxPermSize=192m -XX:PermSize=128m -XX:+UseG1GC -XX:MaxGCPauseMillis=2000 -XX:G1HeapRegionSize=8 -XX:G1ReservePercent=15 -XX:NewRatio=3 -XX:SurvivorRatio=5 -XX:+AggressiveOpts -XX:+UseFastAccessorMethods -XX:+UseBiasedLocking -XX:+UseCompressedOops -XX:+HeapDumpOnOutOfMemoryError -server -verbose:gc -XX:+PrintGCTimeStamps -XX:+PrintGCDetails -XX:+PrintTenuringDistribution -Xloggc:logs/gc.log
24h Tests
After fighting to find the best G1 configuration, we decided to take a step forward and test the CMS and the selected "best" G1 configuration in a 24h tests. The setup was the same, except that we decreed to 2 Invoker processes.
After the machines have been working for 2 complete days, we got the following results:
| Total Run Time | Throughput | Freed MB/Min | Number of Pauses | Avg Pause | Max Pause | Full GC | Number of Full GC | Avg Full GC | Max Full GC | |
|---|---|---|---|---|---|---|---|---|---|---|
| CMS | 23h30m5s | 95.99% | 1033 | 2831 | 1.19s | 4.43s | nein | - | - | - |
| G1 | 23h42m36s | 84.04% | 1632 | 16693 | 0.81s | 23.74s | ja | 41 | 19.82s | 23.74s |
From the above it is clear that the CMS heavily defeated the G1. Not only that the throughput was much higher. but CMS was fast enough not to make Full Garbage Collection needed. On the other hand, seams like G1 was to slow and 41 "stop-of-the-world" pauses occurred, each lasting for 20 seconds in average.
The difference in number of pauses is also high and it's not easy to conclude why G1 needs almost 6 times more pauses.
Here are the graphs showing the difference in the garbage collection activity:
| CMS | G1 |
|---|---|
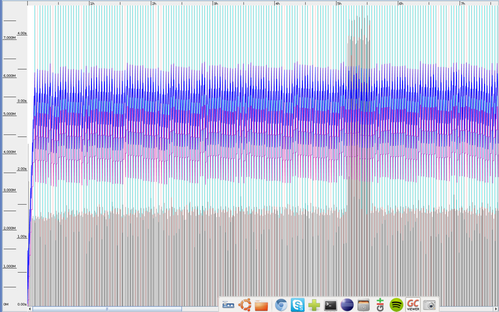 | 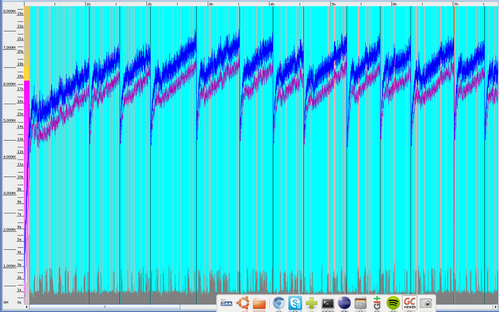 |
Very interesting thing is anomaly in the CMS between 5h-5h30m, because as it is visible in the graph the GC pauses in that period took much more time that the usual ones. Still it is not known why.
Conclusion
One of the conclusions is that the current JVM settings for the inspectIT CMR are absolutely OK. The 95% throughput is very high, maybe even highest possible. Thus, we should continue using these settings.
Regarding the G1, we have to say that we were disappointed. We expected much better results, especially because one of the marketing tones of G1 is that is made for heaps over 6GB. It stayed unclear to us, why is the G1 slow enough to make the Full GCs occur in some point.