Introduction
This feature for inspectIT is launched in the version 1.8 and allows the user to diagnose problems, giving the hint to know which method is taking too much time running.
There are some rules defined in order to diagnose the most typical problems for time wasting. Those rules processed the invocations, diagnosing the problems and offered relevant information.
Prerequisites
In order to see diagnosis information the system must have influxDB connected and writing data.
Also Grafana must be set up and running in order to visualize the information.
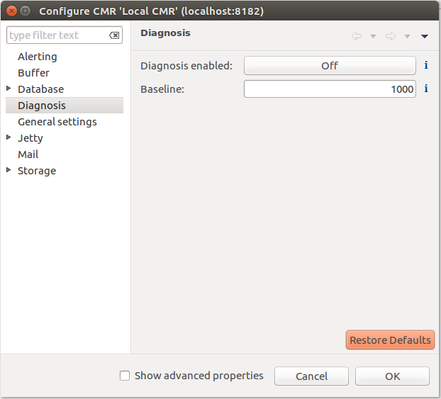
Configuration
By default, automatic diagnose problems will be disabled; it is needed to connect manually the diagnosis feature in the settings menu.
You will see an entry in the menu, under this you will have the enable or disable the function. Also, you can define the baseline this means that all the invocations over this value will be analyzed. The default value for the baseline is 1000 ms.
Data visualization
You can find a dashboard to visualize the information here:
https://grafana.com/dashboards/1691
or by downloading the json and importing it from here:
https://github.com/inspectit-labs/dashboards
Once the system diagnoses one problem it is written in influx, and with Grafana you can access to the diagnosed data:
(Image: Data visualization)
In the dashboard you can find:
- The number of problem occurrences that the system found.
- The mean time for the found problems
- And a table, where you will see:
- The problem context method name
- The root cause method name
- The cause type, which means if the invocation is single, iterative or recursive.
- The source type which can be HTTP, Timer Data or Database.
- The mean time for that invocation in the root method.
You will also visualize the date and time for every invocation.