...
The default dashboards provided on this page have been created with Grafana version 34.10.10.These dashboards may be incompatible with other older versions of Grafana versions.
To use When importing the default dashboards, the data source must be configured correctly. Therefore follow these configuration steps
...
please ensure to select a data source which uses a database that is also used by inspectIT to store long-term data.
| Warning |
|---|
Make sure the data entered above is consistent with the configuration described in Long-term Data Persistence Configuration. In particular, if you used other values for the database name, user, password, etc. then also configure Grafana respectively. |
Available Default Dashboards
To import a dashboard to into Grafana switch to the dashboards view and select Import in the dashboard navigation menudashboard selection menu and press the Import button to open the import wizard. Then upload the corresponding JSON file. 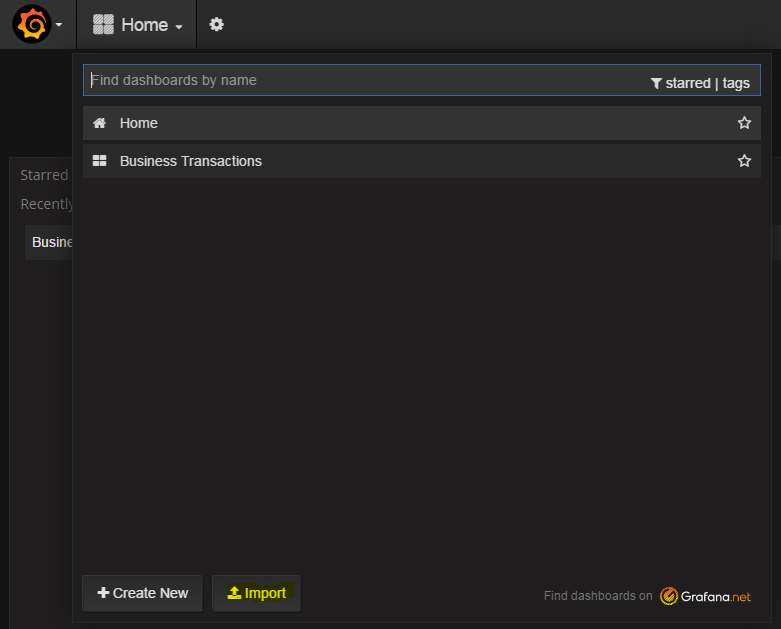 More information how to import dashboards can be found in the official Grafana documentation.
| Info |
|---|
All dashboard files (JSON) can be found in the following GitHub repository: https://github.com/inspectit-labs/dashboards |
The following table shows an overview on default Grafana dashboards provided by inspectIT:
| NameDashboard File | Description | Screenshot | |
|---|---|---|---|
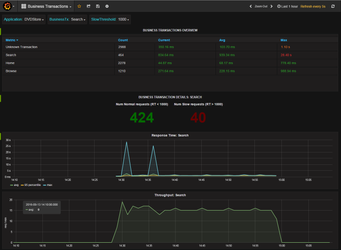
| Business Transactions | BusinessTrnasactionsDashboard.json | Shows an overview on business transaction timings. Allows to select individual business transactions to view detailed graphs on some related metrics (response time, throughput, number of normal and slow requests) |
|
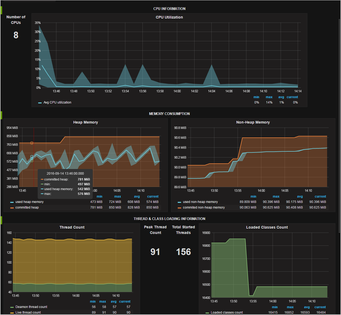
| JVM Information | JVMInformation.json | Shows JVM and System related information depending on the selected agent. This includes CPU utilization of the Java process, memory (heap, non-heap) consumption, thread count, loaded class count and some general JVM infomation. |
|
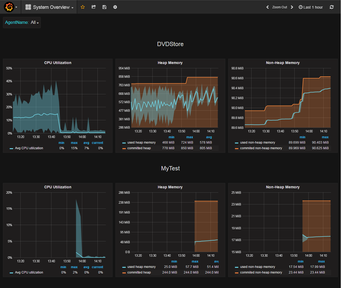
| System Overview | SystemOverview.json | Shows a quick overview over CPU and memory consumption for all selected agents. |
|
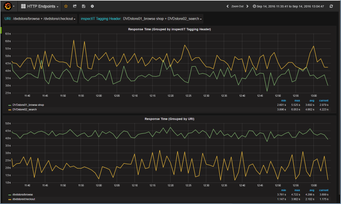
| HTTP Endpoints | HTTPEndpoints.json | Shows timings of HTTP endpoints. |
|
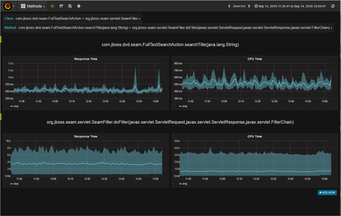
| Methods.json | Shows Response Time and CPU Time of methods for which charting has been enabled in the instrumentation configuration of inspectIT. |
| |
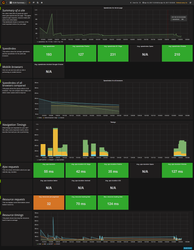
| EUM Summary | Shows an overview with several End-User-Experience Metrics captured using the Javascript End User Monitoring. |
| |
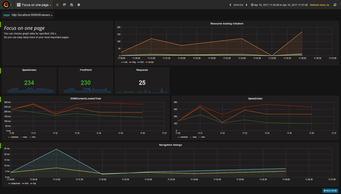
| EUM Focus on Single Page | Displays EUM performance details filtered based on a selectable page URL. |
| |
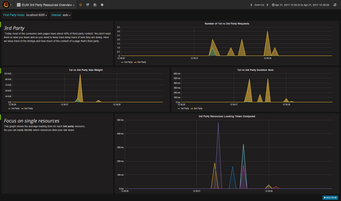
| EUM 3rd Party Resources Overview | Shows details on how 3rd Party content slows down the page loading times. |
|