...
| Name | Dashboard File | Description | Screenshot |
|---|---|---|---|
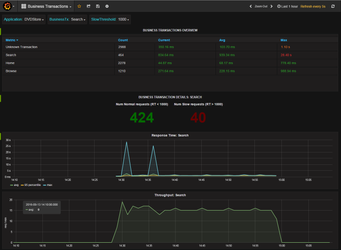
| Business Transactions | BusinessTrnasactionsDashboard.json | Shows an overview on business transaction timings. Allows to select individual business transactions to view detailed graphs on some related metrics (response time, throughput, number of normal and slow requests) |
|
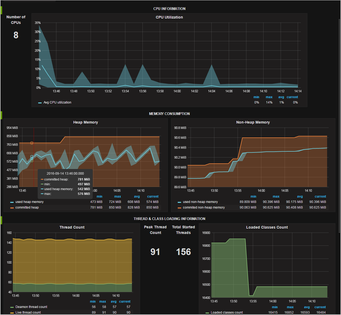
| JVM Information | JVMInformation.json | Shows JVM and System related information depending on the selected agent. This includes CPU utilization of the Java process, memory (heap, non-heap) consumption, thread count, loaded class count and some general JVM infomation. |
|
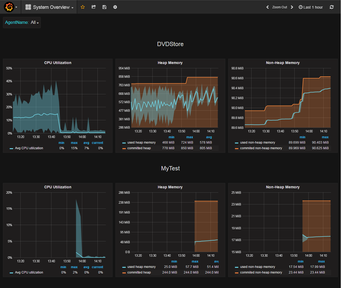
| System Overview | SystemOverview.json | Shows a quick overview over CPU and memory consumption for all selected agents. |
|
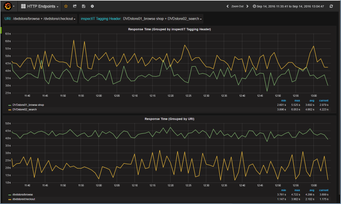
| HTTP Endpoints | HTTPEndpoints.json | Shows timings of HTTP endpoints. |
|
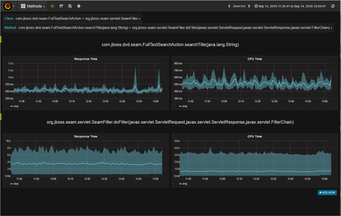
| Methods | Methods.json | Shows Response Time and CPU Time of methods for which charting has been enabled in the instrumentation configuration of inspectIT. |
|
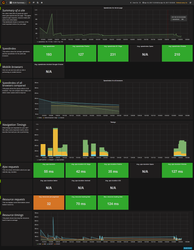
| EUM Summary | Shows an overview with several End-User-Experience Metrics captured using the Javascript End User Monitoring. |
| |
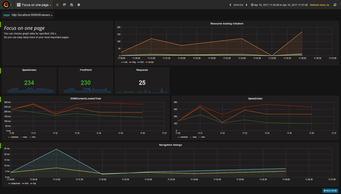
| EUM Focus on one pageSingle Page | on one page | Displays EUM performance details filtered based on a selectable page URL. |
|
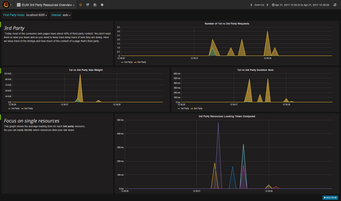
| EUM 3rd Party Resources Overview | Shows details on how 3rd Party content slows down the page loading times. |
|