The TVBrowser is an open-source TV guide which was used for the inspectIT workshop. It is more complicated then the Calculator Example but not as complicated as an Enterprise application. Therefore this is another example where inspectIT can be used to gather performance information. The actual version of the TV Browser can be found on the official page at http://www.tvbrowser.org. For the workshop the TV Browser was used in the version 2.7.4. The complete source code and the main application are attached to this page.
TV Browser Application
The TV Browser is a digital TV guide. It shows the daily TV program in the same way as a printed TV guide. Aside from the TV program it also presents the program of radio channels. For updating the information an internet connection is needed. Currently it provides more than 900 TV stations and around 100 radio channels. It's free to use and open-source. Due to these facts it's possible to use it within the inspectIT workshop.
Program functionality to be measured
Some actions in the TV Browser take a longer period of time when they are executed. For example updating the TV and radio program or updating the available TV/Radio channels.
In the below screenshot you can see how updating the TV/radio programs can be performed. Depending on the selected data sources the runtime of the update can vary (especially BBC Data takes a much longer time than the other sources).
Updating the channel list may also take a longer period of time. The following screenshot shows how channel information can be retrieved to get the newest channels.
Setting up inspectIT
Folder structure
The workshop was performed using Ubuntu and the needed inspectIT artifacts for Linux. All the artifacts where extracted to the folder workshop. The below table contains an overview over the directory structure.
Directory | Description |
|---|---|
workshop/Agent | Contains the inspectIT Agent which needs to be added to the startup script of the TVBrowser. This folder contains the inspectit-agent.jar and the configuration file needed for the instrumentation |
workshop/CMR | Contains the Repository files. The Repository must be started by using the start script (startup.sh / startup.bat) |
workshop/inspectIT | Contains the User Interface. The UI can be started by just executing the start script |
workshop/tvbrowser-2.7.4 | This folder contains the TVBrowser application which will be instrumented by using inspectIT |
Starting the CMR
The CMR can be started by just executing the startup script. Depending on the operating system where the CMR is executed the startup script is either startup.sh or startup.bat. After starting the CMR the licence file needs to be imported.
Importing the Licence File
The licence file can be imported by starting the User Interface and simply importing it. The needed steps are described below.
1. Ensure that the CMR is still running
2. Start the inspectIT user interface using the provided startup script
3. Use the license import functionality (Repository Manager -> License Information -> Import License) and select a valid license (you can get a valid license on official InspectIT website).
Integrating the inspectIT Agent into the TV Browser
To instrument the TVBrowser the inspectIT Agent needs to be integrated into the TVBrowser by two steps. First there must be defined where the inspectit-agent.jar can be found. The second step would be the indication of the residence of the configuration file. The below listing shows the two needed steps.
java -javaagent:/home/user/workshop/Agent/inspectit-agent.jar -Dinspectit.config=/home/user/workshop/Agent/config -jar tvbrowser.jar
Configuration of the inspectIT Agent
The delivered inspectIT Agent has a simple configuration file where some sensors are already activated/defined. E.g. the timer sensor and the invocation sequence sensor are both defined, but the mapping on the methods to be instrumented needs to be adjusted. All the platform sensor are already activated and ready for use (there are no additional adjustments needed for them).
Monitoring the TV Browser
In this section we will introduce how inspectIT can be used to find the reason for the time consuming update processes described before. This is done in some steps. Every step contains instructions and screen shots of inspectIT. With the screen shots it should be possible to verify if you have done the step correct. Additionally the configuration file is attached to every step. You can find the necessary lines at the end of the configuration file under ## Your sensor definitions.
Step One - using the Timer Sensor
As we already mentioned some updating actions taking a longer execution time. So at this point we think that the update time is maybe to high. So we have questions like:
- How long takes an update of the channel programs?
- How many times has the method responsible for the update been called? (You think one time? But can you be sure? This is not obvious, maybe the method who invokes the update is invoked several times instead of only one)
- Which method has invoked the update? (condition that you don't know the exact method)
After looking inside the code we found the interface TvDataService which provides the method updateTvData(...). As we don't now exactly which class implementing this interface is responsible for the update process we will instrument all implementing classes. Remember that this could be dangerous if too many methods are instrumented by this definition. If you know the classes before then you can make specific definitions only for this classes.
Outcome
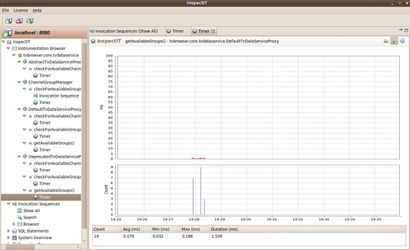
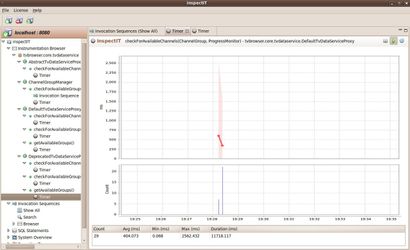
The two screenshots are showing the result of this step. With the definition we instrumented 6 classes which are implementing the interface TvDataService. If you have selected all possibilies for the updating (Radio Times Data, BBC Data) you see two time measures, one for BbcBackstageDataService and the other for RadioTimesDataService.
With this definition we measured the duration of the update process. We found out the responsible methods and their durations. Currently we don't know anything about the composition of the duration. This means we don't know what happens inside the method. Therefore we use in step two the Invocation Sequence Sensor and looking deeper in the inside of methods.
Here you can download the configuration file for this step: Configuration File Step 1.
Step Two - using the Invocation Sequence Sensor
In the first step we measured the update time of the channel programs. In this step we will monitor the update of the channels list which was also mentioned earlier. The result of step one was only the whole update time for the program list. We didn't get any information about the composition of the time. That means, we don't know what has happened inside this method. So in this step we use the invocation sequence sensor to measure not only the execution time of the method but also the execution times of some children.
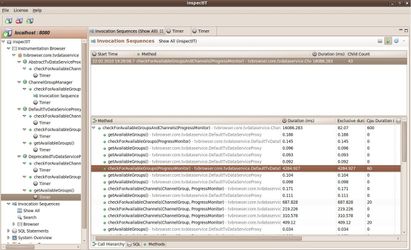
In this step the list of channels will be updated. We found out that this is done by the method checkForAvailableGroupsAndChannels(...) of the class ChannelGroupManager. Currently we don't know how the execution time is composited. Therefore we define timer sensors for methods which are called from the method checkForAvailableGroupsAndChannels(...), in our case these are the methods checkForAvailableGroups(...), checkForAvailableChannels(...) and getAvailableGroups() of interface TvDataServiceProxy.
Outcome
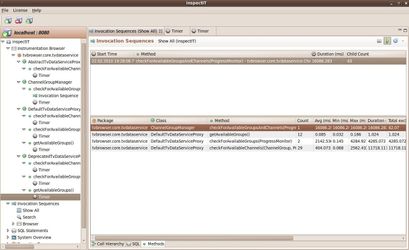
You can see the invoaction tree on the first image. The second image shows an aggregated view of the called methods. There you can quick get information like how often a method is called and the execution time of the method. In our case you can see that the method checkForAvailableGroupsAndChannels(...) has an execution time of approximately 16 seconds. Most of the time is composed from the nested methods. You can see this by means of the total exclusive duration of 82 ms. This value represents the time the program was inside this method or methods which are not covered with timer sensors.
The nested method checkForAvailableChannels(...) has an overall execution time of approximately 12 seconds. The method was called 29 times with an average execution time of 400 ms. The other nested method checkForAvailableGroups(...) is more interesting. It was called only two times with an average execution time of 2 seconds. The interesting facts are the huge gap between the maximum (4282 ms) and minimum execution time (0.145 ms) and the total execution time of 4.3 seconds which make up a quarter of the duration time of the method checkForAvailableChannels(...).
If you want to practice more with the invocation sequence you can go deeper into the nested methods to identify the composition of the methods. Maybe you can find out if the huge gap between the two calls of method checkForAvailableChannels(...) is normal behaviour or if the two measurements are outliers.
We learned in this step how the invocation sequence sensor is used to get more information about the composition of method execution times. Beside the execution time and the number of calls of methods you get an idea about the invocation sequence inside your application visualized by the invocation tree.
Here you can download the configuration file for this step: Configuration File Step 2.
Step Three - using the Exception Sensor
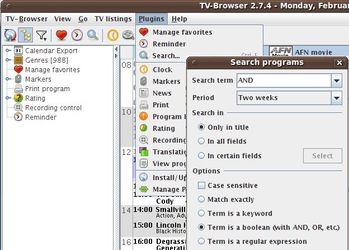
In the last step we use the exception sensor to get information about exceptions which were thrown during the execution of the TV Browser Application. An exception of type TvBrowserException can occur when you use the search plugin. Type in AND for the search string and select the boolean search to produce an exception. The following screenshot shows where you can find the search dialog within the application.
Outcome
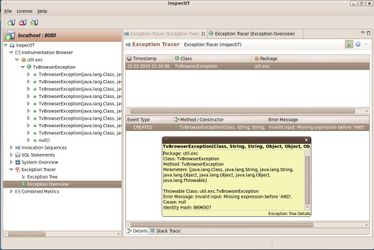
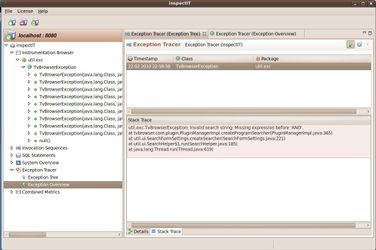
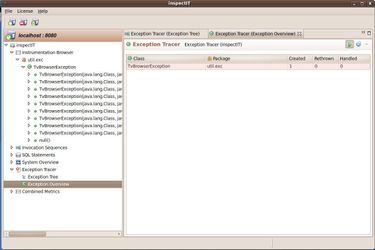
As result you should see that an exception of type TvBrowserException was created (first image). The exception sensor also provides the stacktrace which you can see in the second image. In the last image you find an overview over all exceptions occurred during the execution of the application.
You can use the Exception Sensor for gathering information about exceptions thrown in your application. The tree structure can show the creator and handler of the exception and where the exception is rethrown. The amount of thrown exceptions could be an indicator for the stability of your application.
Here you can download the configuration file for this step: Configuration File Step 3.
Affected tickets
[INSPECTIT-67|https://jira.novatec-gmbh.de/browse/INSPECTIT-67]
