inspectIT Big Picture & Scope
inspectIT is an open source Application Performance Management solution. We deliver a Web-based user interface to visualize your application's behavior and to give you an easy understanding of how your application is behaving. In addition, we provide a sophisticated rich client user interface that allows you to configure inspectIT and to drill down into the details of requests for problem detection and root cause analysis. The remainder of this page gives you an overview of the inspectIT ecosystem and points you to the documentation entries that detail the information.
The Big Picture
At the core of inspectIT, we provide in-depth analysis functionality by gathering detailed call graphs (we call them invocation sequences - more details) for requests. This information is provided by our agents running within the application itself (currently we provide a stable agent for Java - we do have a prototype for a /wiki/spaces/ROAD/pages/10092661 and we are actively working on browser agents and mobile agents). The data they gather is sent to the central server (CMR) using a well-defined interface. Using the rich client user interface (more information), you can query detailed information and analyze problems. inspectIT also comes with sophisticated business mapping of requests (more information) - allowing you to visualize the data of your application from a business use case perspective.
All data gathered by these agents is also persisted in the long term monitoring database. The data can be nicely aggregated and visualized by our Web-based monitoring user interface. You can also attach your own analysis tool to the monitoring database to execute your own reports and analysis. You can also easily integrate additional information that you need from a monitoring perspective using the Host Agent Interface. Using this interface, you can integrate system (e.g., CPU, memory, and I/O) and operating system information, e.g., over the collectd inspectIT integration.
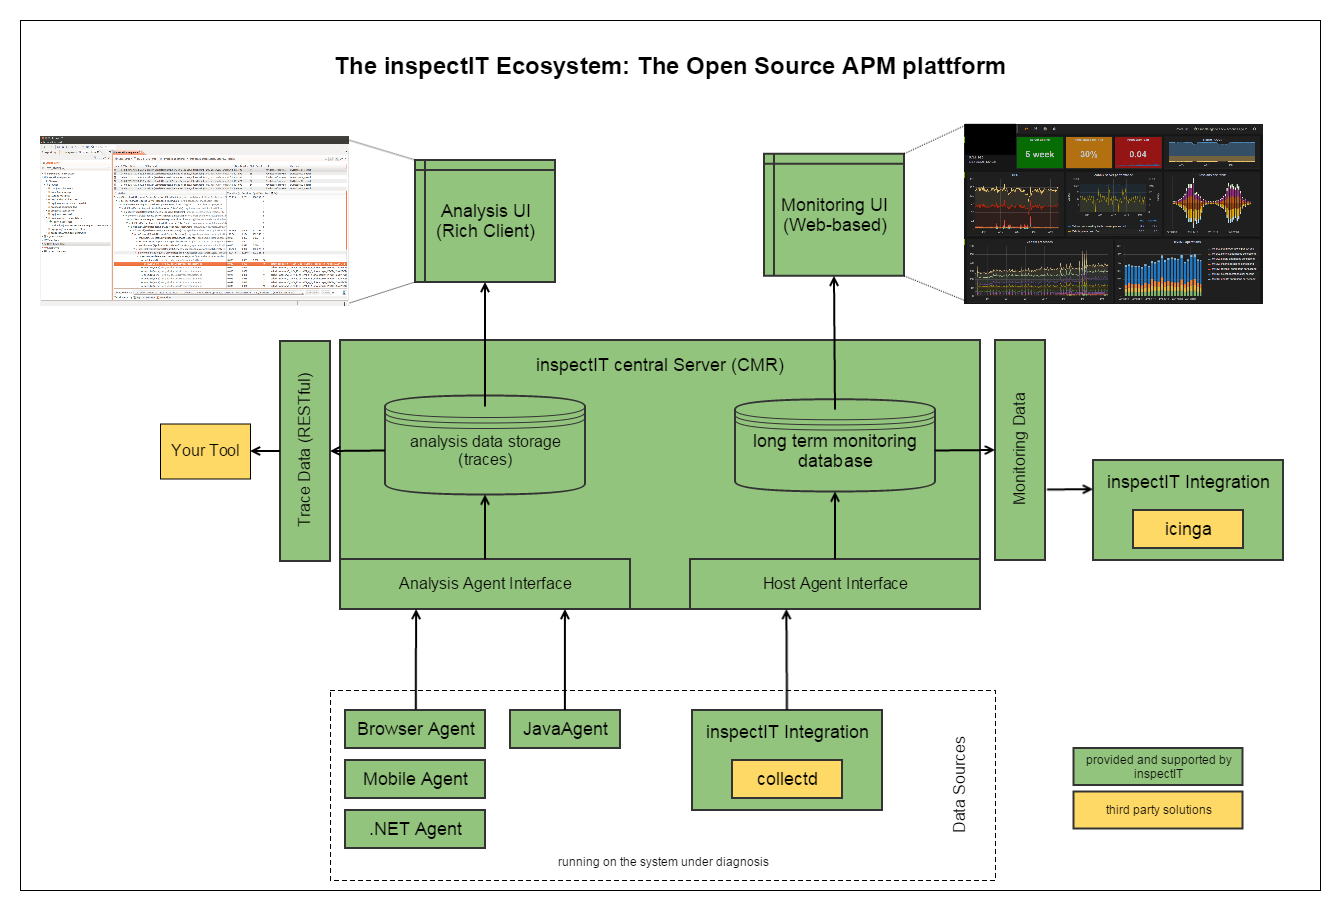
inspectIT is a completely open system. Write your own agent and connect it to the system to extend the functionality. Read data from the CMR via our RESTful Services. Write additional monitoring data into our monitoring database. Query the long term monitoring database with your own reporting (e.g., to write them to another monitoring system, like we do with icinga), integrate the data into other system, or adapt the visualization.