...
The inspectIT currently supports tracing of remote communication made by HTTP and JMS. Full list of supported technologies and libraries can be found on the Remote sensors page. The remote sensor provide following out-of-the-box tags based on the technology:
| Technology | Tag | Description |
|---|---|---|
| HTTP | URL | Complete URL of the call. |
| Status | Response code of the call. | |
| Method | Used HTTP method. | |
| JMS | Message ID | ID of the JMS message. |
| Destination | Destination of the JMS message. |
Configuration
As mentioned the configuration for the remote sensors in provided as part of Common profiles and is active by default. However, the inspectIT provides a special Remote Manual Server Sensor. Users can use this sensor to mark additional methods where server spans should be started. This is usually useful for tracing batch jobs, as the users can mark methods where their batch job is starting and thus also get a complete trace of it's execution. Please read Sensor assignments configuration for information on how to apply any sensor to a method.
...
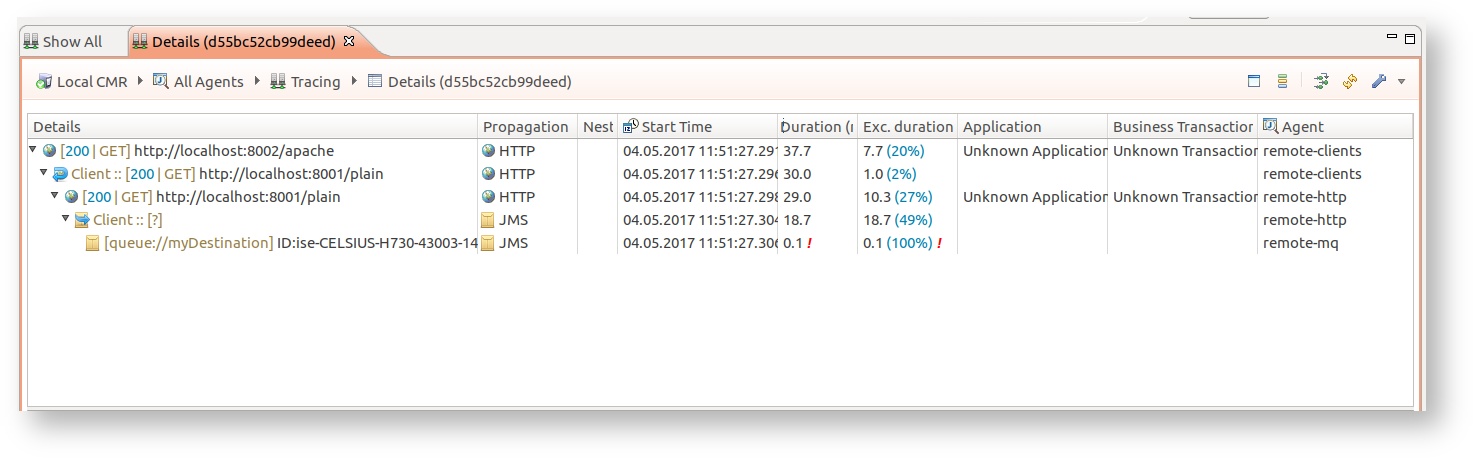
The top part of this view provides an tree representation on trace spanning on the multiple JVMs (agents). Here it's possible to understand duration of each trace part (span) as well as to clearly differentiate client and server spans (request execution). The following tables describes in details each column and data/icon shown:
| Column | Description |
|---|---|
| Details | Provides details on trace part, clearly separates client and server span, plus provides any additional information based on the technology that made span. Client spans provide info if call was synchronous or asynchronous. |
| Propagation | How was span created, usually represents technology of the remote propagation. User created spans are clearly marked here with SDK. |
| Nested Data | Shows if this trace part has nested SQL statements and/or Exceptions, based on the invocation sequence created for that trace part. |
| Start time | Start time of span. Note that this time is agent relative. |
| Duration | Total duration of the trace part. For asynchronous client spans this time is actually only time needed to create/send asynchronous request and not the real time of that request execution. |
| Exclusive duration | Exclusive duration of the trace part. This duration does take info account duration of asynchronous request. |
| Application | Assigned application, based on the invocation sequence created for that trace part (if any). |
| Business transaction | Assigned business transaction, based on the invocation sequence created for that trace part (if any). |
| Agent | Agent where this trace part was executed. |
| Icon | Description |
|---|---|
| Propagation via HTTP communication. |
| Propagation via JMS communication. |
| Denote user spans that were created by inspectIT SDK. |
| Synchronous call. |
| Asynchronous call (or any non-depending/follows from call). |


Complete trace call hierarchy
...